Understanding Intraday Trading in Forex
Intraday trading in the forex market involves the buying and selling of currency pairs within a single trading day. This short-term trading approach focuses on capitalizing on minor price movements, necessitating strategic planning and often requiring traders to closely monitor markets. A deep understanding of market dynamics and price action is pivotal for traders who aim to discover cleaner intraday setups, making informed decisions based on current market conditions.
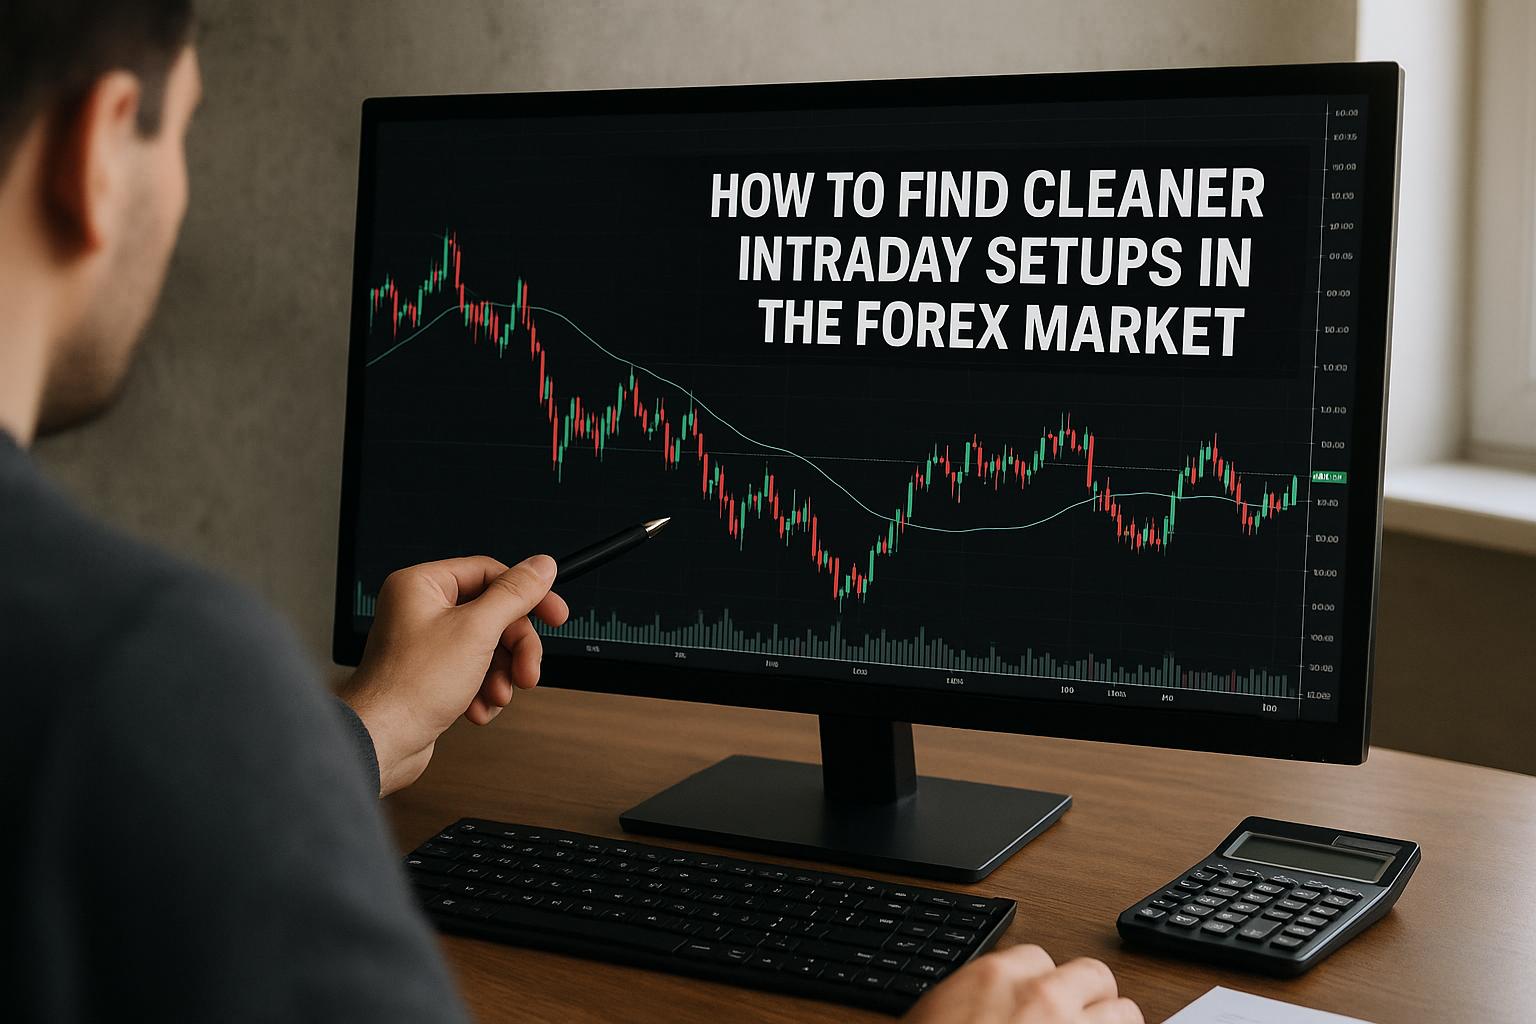
Price Action Analysis
Price action analysis is a fundamental aspect of intraday trading. Price action refers to the fluctuation in the price of a currency pair as it is plotted over a given period on a chart. By examining these movements, traders can forecast potential future price trends. Several key techniques form the backbone of price action analysis:
Candlestick Patterns: Candlestick patterns are visual representations of price movements and can indicate potential reversals or continuations in a trend. Common patterns such as the ‘Doji,’ ‘Hammer,’ and ‘Engulfing’ are often watched by traders to make predictions about price behavior.
Trend Lines: Drawing trend lines is another method of understanding the direction of the market. Trend lines connect pivot highs or lows, allowing traders to estimate potential support and resistance areas, providing insights into the strength of a trend.
Support and Resistance Levels: These horizontal lines indicate where the price has historically had difficulty moving above (resistance) or below (support). Understanding these levels is crucial, as they often influence future price movements. For a more comprehensive understanding of price action strategies, resources such as BabyPips can be valuable.
Technical Indicators
In addition to price action analysis, technical indicators play a significant role in refining intraday setups in the forex market. They can offer additional insights into potential market trends and reversal points. Commonly used technical indicators in the context of intraday trading include:
- Moving Averages: These are used to smooth out price data, helping traders identify the direction of the trend over a particular period. Shorter moving averages are often used for faster signals in active trading environments.
- Relative Strength Index (RSI): This momentum indicator measures the magnitude of recent price changes to evaluate overbought or oversold conditions in the price of an asset. It ranges from 0 to 100, with values above 70 typically indicating overbought conditions.
- Bollinger Bands: Bollinger Bands consist of a middle band (a moving average) and two outer bands that correspond to standard deviations. They help in identifying volatility and potential price reversals by indicating whether prices are high or low on a relative basis.
Timeframes for Intraday Trading
The selection of an appropriate timeframe is critical in intraday trading, as different timeframes can offer varying levels of insight into market behavior. Typical intraday timeframes include:
- 1-Minute Charts: These charts provide the most detailed market data and up-to-the-minute price movements, but they may also result in information overload, requiring traders to differentiate between noise and valuable signals.
- 5-Minute Charts: Considered by many traders to be the sweet spot for intraday trading, these charts offer a balance between detailed information and broader market context, allowing for the identification of short-term trends and reversals.
- 15-Minute Charts: Offering a more comprehensive perspective on market trends, these charts are used for spotting medium-term patterns and can provide a steadier analysis of the market situation.
Risk Management Strategies
Effective risk management is a cornerstone of successful intraday trading. The volatile nature of the forex market means that traders must carefully manage their risk exposure to protect their capital. Some common risk management strategies include:
Utilizing stop-loss orders is a fundamental approach to mitigating potential trading losses. A stop-loss order automatically closes a trade when the price reaches a predetermined level, ensuring that losses are kept within acceptable bounds. Intraday traders often limit their risk per trade to a small percentage of their trading capital, typically ranging between 1% and 2%.
Developing a Trading Plan
Developing a well-defined trading plan is a critical step in identifying and executing clear intraday setups. A comprehensive trading plan should outline specific entry and exit strategies that align with the trader’s objectives and market conditions. It should also detail risk management policies and the criteria for identifying trading opportunities. An effective trading plan is not static; it requires regular review and adjustments to remain aligned with evolving market behaviors and dynamics.
By developing a thorough understanding of forex market dynamics and employing a systematic approach enhanced by technical indicators and analytical strategies, traders can discover cleaner intraday setups. This knowledge, coupled with disciplined execution of well-formulated trading plans, equips traders to make more informed and strategic trading decisions, improving their likelihood of success in the fast-paced forex market.
In conclusion, intraday trading in the forex market demands a combination of theoretical knowledge and practical application. The skills and strategies discussed, when integrated effectively, can enhance a trader’s ability to navigate the complexities of intraday trading. Regular learning and adaptation to market changes remain critical to maintaining an edge in this competitive trading environment.
This article was last updated on: April 10, 2026