Day trading refers to the buying and selling within the same trading day. Traders aim to utilize the market’s short-term fluctuations to make a profit, and being able to identify trends is often a crucial aspect of their strategy. This article will delve into how traders can identify trends in day trading, using technical analysis, chart patterns, and various indicators.
Understanding Trends
In the context of day trading, a trend refers to the general direction in which the price of an asset is moving. Trends can be upwards (bullish), downwards (bearish), or sideways (neutral). Understanding these trends is fundamental as it can provide insight into potential price movements and help identify trading opportunities.
Technical Analysis
Technical analysis is a prevalent method used by traders to identify trends. It involves studying price patterns, volume, and indicators to predict future price movements.
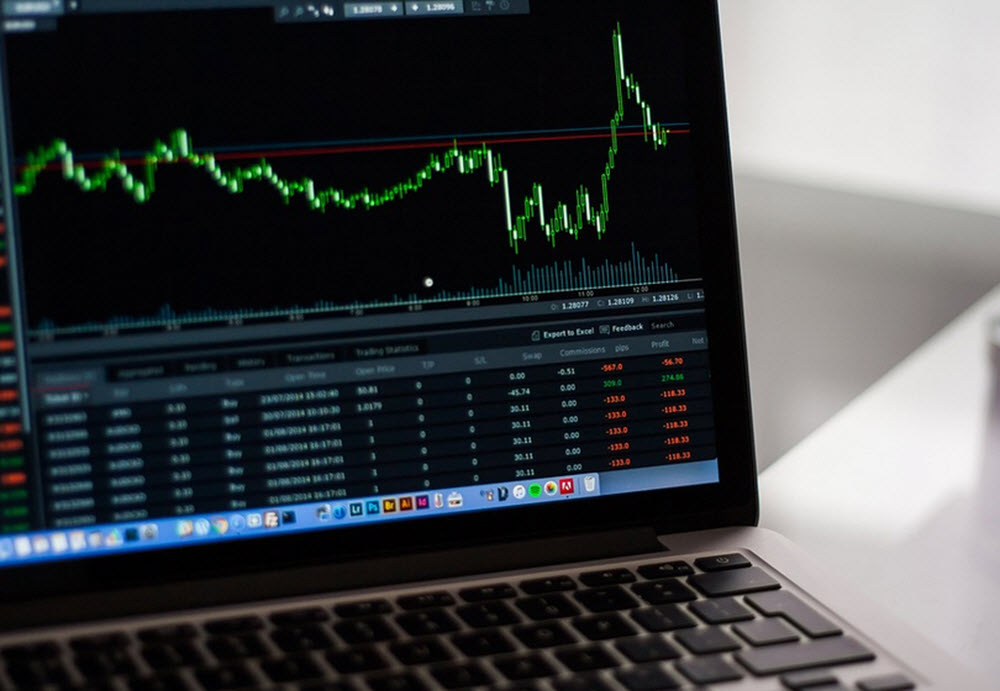
– Price Charts: These are graphical displays of an asset’s price over a specific period. Line charts, bar charts, and candlestick charts are commonly used types. Traders can identify trends by drawing trendlines or using moving averages.
– Volume: Volume is the number of shares or contracts traded in a security or market during a given period. High volume often indicates strong investor interest and can be a sign of the start of a new trend.
Chart Patterns
Chart patterns are distinct formations created by the movements of security prices on a trading chart. They can signify continuations or reversals of trends. As a beginner, it can be tempting to try and find out “the best overall chart pattern”, but the reality is that they all come with their own pros and cons, and they are used to highlight different trends. The market conditions can impact which chart patterns are more reliable and more useful right now. Some chart patterns are more suited to volatile market conditions, some chart patterns give more useful information in a bullish market (as opposed to bearish), and so on.
Here are some examples of chart patterns:
– Head and Shoulders: This pattern signals a reversal trend. It features three peaks, with the middle one being the highest (the head) and the two others (shoulders) being lower.
- Double Top: This pattern indicate a reversal of a trend. Double tops occur after an upturn, signaling a drop. This is because it is common for the price to experience a peak, then retract down to a support level, then climb up again, and then begin to go down for a longer period of time.
- Double Bottom: This pattern also indicate a reversal of a trend, but double bottoms occur after a downturn, signaling a rise. The double bottom chart pattern indicates a period of selling (causing the price to drop below a support level), then a period of buying that will cause the price to rise up to a level of resistance, and then a period when the price drops again, before the final reversal where a more sustained upward motion will start and the market will become bullish.
- Rounding Bottom: The rounding bottom chart pattern can be a sign of either a continuation or a reversal, so it is tricky to interpret and needs to be analysed in conjunction with other information.
- Triangles: These appear when the price range narrows over time. Ascending triangles indicate a bullish trend, descending triangles suggest a bearish trend, and symmetrical triangles show uncertainty.
Indicators
Indicators are mathematical calculations used to forecast future price changes. Here are a few examples:
– Moving Averages: These smooth out price data to form a trend following indicator. They do not predict price direction but define the current direction with a lag.
– Relative Strength Index (RSI): This momentum oscillator measures the speed and change of price movements. Generally, an RSI above 70 suggests an overbought market (bearish trend), while an RSI below 30 indicates an oversold market (bullish trend).
– Moving Average Convergence Divergence (MACD): This trend-following momentum indicator shows the relationship between two moving averages of a security’s price. Traders use MACD to identify potential buy and sell signals.
Conclusion
Identifying trends in day trading is a combination of art and science, requiring both analytical skills and intuition. By utilizing technical analysis, understanding chart patterns, and interpreting indicators, traders can make more informed decisions and capitalize on the market’s movements. However, it’s essential to remember that while these tools can provide valuable insights, they do not guarantee success, and all trading involves risk. Always use risk management strategies and consider seeking advice from financial professionals.
This article was last updated on: May 19, 2024