Understanding Multiple Time Frame Analysis
Multiple Time Frame (MTF) analysis is a strategic approach employed by traders in the Forex market to gain a comprehensive view of currency price movements. It involves examining different time frames of the same currency pair to make informed trading decisions. This technique can help traders identify long-term trends, potential reversals, and entry and exit points more accurately.
At its core, MTF analysis is built on a simple premise: price action reflects different information depending on the time horizon being observed. A five-minute chart may reveal immediate buying or selling pressure, while a weekly chart reflects broader economic forces and institutional positioning. By combining these perspectives, traders can reduce the risk of acting on incomplete information. Rather than relying on a single snapshot of market activity, MTF analysis offers a layered framework through which price behavior can be interpreted with greater clarity.
In the decentralized and highly liquid Forex market, where currencies respond to macroeconomic data, geopolitical developments, and speculative flows, understanding context is critical. Multiple time frame analysis provides that context. It enables traders to locate short-term opportunities within the structure of longer-term trends, aligning tactical decisions with strategic direction.
Why Use Multiple Time Frame Analysis?
In the dynamic world of Forex trading, price movements are essentially in constant flux. Relying solely on a single time frame often provides a fragmented or incomplete view of the market. By adopting MTF analysis, traders can achieve a more rounded perspective by gaining insights into both the micro and macro aspects of market trends. The utility of this analysis is not just confined to simply observing price movements but extends to deeper interpretations and predictions of market behavior.
One of the principal reasons traders incorporate multiple time frames is to distinguish between noise and meaningful price movement. Lower time frames frequently display sharp fluctuations that appear significant but have little relevance within a larger directional move. When these movements are evaluated against a higher time frame trend, their relative importance becomes clearer. This helps traders avoid reacting impulsively to temporary volatility.
MTF analysis also assists in improving trade timing. A trader may identify a strong bullish trend on a daily chart but entering immediately without reference to shorter-term conditions can result in unfavorable entry prices. Observing a smaller time frame can reveal pullbacks or consolidation phases that provide more efficient entry points, thereby improving risk-to-reward ratios.
Consistency is another advantage. When multiple time frames point in the same directional bias, the probability of continuation may increase. While no analytical method guarantees outcomes, alignment across charts often indicates that short-term and long-term participants are acting in comparable directions. This alignment reduces uncertainty compared to trading against the broader trend.
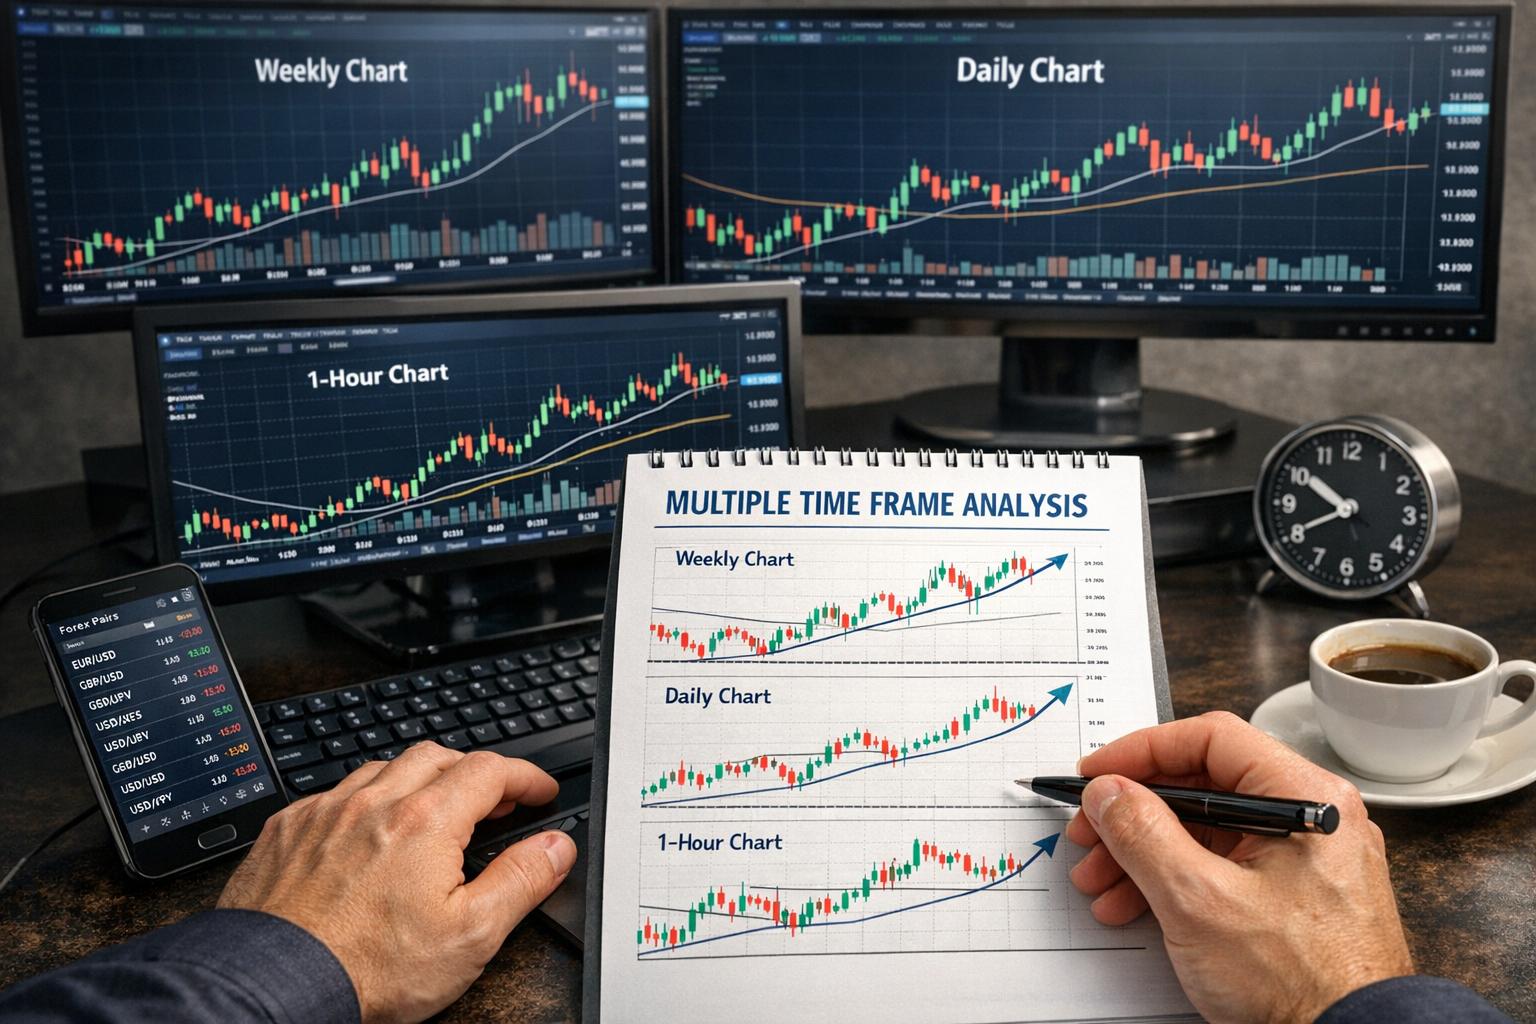
The Three Common Time Frames
MTF analysis typically involves examining three different time frames, and each one serves a specific purpose, providing a unique layer of insight into the market dynamics:
Long-Term: Long-term analysis is generally represented by daily or weekly charts. This time frame is crucial for establishing the primary market trend, whether it be bullish, bearish, or ranging. Understanding the general direction of the market enables traders to align their strategies in harmony with the prevailing trend, thus increasing the likelihood of success. By observing the long-term time frame, traders can better gauge the overall market sentiment which can significantly influence trading decisions over extended periods.
On long-term charts, structural elements such as major support and resistance zones, prolonged consolidation ranges, and multi-month trendlines become more visible. These levels often attract institutional interest and serve as reference points for market participants managing large positions. Identifying these zones provides traders with a framework within which shorter-term price action unfolds.
Medium-Term: Represented usually by 4-hour or daily charts, this time frame occupies the middle ground between long-term strategic outlook and short-term tactical moves. Medium-term analysis helps traders identify intermediate trends and corrections within the primary trend identified in the long-term frame. It’s an effective way of spotting potential retracements or consolidation phases that might have temporary influence over the prevailing market trend. Analyzing the medium-term can provide clarity regarding the sustainability of the observed primary trends and highlight moments when the market might diverge from its current path.
The medium-term time frame frequently displays chart patterns such as flags, wedges, or head-and-shoulders formations as they develop within the broader context. This level of analysis can reveal whether a pullback is orderly and controlled or whether it is evolving into a deeper reversal. Traders often refine their scenario planning on this time frame, preparing conditions under which they will act once confirmation appears on a lower chart.
Short-Term: This time frame employs 1-hour or 15-minute charts. In a section of heightened activity, the short-term time frame provides signals that are crucial for determining precise entry and exit points. While embedded in the broader context of the market environment determined by the long- and medium-term frames, short-term analysis informs the tactical decisions that can greatly influence the profitability of trades. This is the time frame where traders often execute their trades, making it fundamental to synchronize decisions with the overarching trends recognized in the broader market analysis.
Short-term charts make smaller support and resistance levels visible and allow traders to observe how price reacts at predetermined higher-time-frame zones. Candlestick formations, momentum shifts, and breakout behavior on these charts offer actionable triggers. However, these signals are most effective when interpreted within the structure defined by the higher time frames.
Integrating MTF Analysis into Forex Strategies
Successful integration of MTF analysis into a coherent Forex trading strategy can significantly enhance decision-making efficiency. Here’s a generalized step-by-step approach to implement MTF analysis in trading:
1. Start with the Long-Term Chart: Upon commencing, traders first determine the direction of the overall market trend. Identifying whether the trend is bullish, bearish, or ranging sets a framework that guides subsequent analysis and execution steps. Traders often mark significant price levels, historical turning points, and dominant trendlines at this stage. These references remain relevant as analysis progresses to lower charts.
2. Check the Medium-Term Chart: It’s essential next to evaluate any existing pullbacks or intermediate trends that may impact the sustainability of the prevailing long-term trend. This time frame provides a clearer picture of market corrections and consolidations—elements that can temporarily cloud or interfere with the overall market direction. Traders assess whether the medium-term structure supports continuation or hints at exhaustion.
3. Examine the Short-Term Chart: In this phase, traders seek more granular insights that help identify precise points for entering and exiting trades. The short-term analysis is intricately aligned with the overall trend direction identified earlier, ensuring that trades are executed in a favorable context. Confirmation mechanisms, such as breakouts from consolidation or momentum shifts near higher-time-frame support or resistance, may guide execution.
Thorough application of each step is necessary to maximize the potential of MTF analysis, facilitating more informed and potentially profitable trading decisions. Discipline in following the top-down sequence prevents overemphasis on immediate price noise and reinforces a structured approach to market engagement.
Using Technical Indicators Across Time Frames
While MTF analysis is fundamentally rooted in price action, many traders incorporate technical indicators to supplement their observations. Indicators such as moving averages, Relative Strength Index (RSI), and Moving Average Convergence Divergence (MACD) can be applied across different charts to reinforce directional bias.
For example, a rising 200-period moving average on a daily chart may confirm a long-term uptrend. If the 4-hour chart shows price retracing toward a shorter moving average within that structure, traders may interpret this as a pullback within a broader bullish phase. On the 1-hour chart, bullish momentum divergence or a crossover signal might then provide tactical confirmation. The emphasis remains on consistency across time frames rather than isolated indicator readings.
However, applying too many indicators on multiple charts can create redundancy and confusion. Indicators often derive from similar price data, meaning excessive layering may not provide additional insight. A structured and minimal approach frequently supports clearer interpretation.
Risk Management Within a Multi-Time Frame Framework
Risk management becomes more precise when informed by multiple time frame analysis. Stop-loss levels can be positioned based on higher-time-frame structures rather than arbitrary distances. For instance, if entering on a 1-hour chart near a support zone derived from the daily chart, a stop may be placed beyond that broader structural level. This approach ties trade invalidation points to meaningful market context.
Position sizing may also be influenced by alignment across time frames. When long-, medium-, and short-term charts display unified directional bias, some traders may allocate risk more confidently within predefined limits. Conversely, partial alignment or transitional conditions may prompt reduced exposure until clarity emerges.
Common Mistakes in Multiple Time Frame Analysis
Despite its structured nature, MTF analysis can be misapplied. One common issue involves selecting time frames that are too closely spaced, such as comparing a 15-minute chart with a 5-minute chart. In such cases, the informational difference between charts may be minimal, limiting the broader perspective that MTF aims to provide.
Another frequent mistake is ignoring higher-time-frame signals when they conflict with short-term setups. Traders may become focused on immediate opportunities and disregard the larger market structure. This approach can result in trades that oppose dominant trends, increasing exposure to unfavorable momentum.
Overanalysis is also a consideration. Continuously shifting between numerous charts without a defined process may produce uncertainty rather than clarity. Establishing a consistent sequence—typically from higher to lower time frames—helps mitigate this risk.
Potential Challenges of MTF Analysis
No trading strategy is without its own set of challenges, and MTF analysis is no exception. One primary challenge is the potential for conflicting signals between the different time frames. For instance, while a long-term chart might indicate a bullish trend, a medium-term pullback could suggest bearish conditions, creating a dilemma for traders. Navigating these discrepancies requires careful consideration and robust analytical skills.
In such situations, traders often give priority to the higher time frame, interpreting lower-time-frame weakness as temporary unless structural breaks occur. Distinguishing between a corrective retracement and a genuine trend reversal demands careful assessment of price structure and momentum across charts.
Additionally, MTF analysis can be quite time-intensive. Monitoring multiple charts and performing recurring evaluations necessitates effort and a substantial time commitment. Traders should be well-versed in technical analysis and competent in recognizing patterns to use this method to its greatest effect. Acquiring these skills might require additional time devoted to learning and mastering MTF analysis intricacies, beyond mere chart observation.
Technological factors can also influence effectiveness. Platform layout, chart organization, and data consistency across time frames must be reliable to support accurate assessment. Maintaining a clean and structured charting environment is beneficial when working with several horizons simultaneously.
In conclusion, by implementing Multiple Time Frame analysis, traders can significantly enhance their market perspective. This facilitates more informed decision-making that transcends the insights normally provided by singular time frame analysis. This layered approach offers traders a robust tool to navigate the complex Forex market efficiently, thus potentially providing a significant edge in trade execution and ongoing management. Implementing MTF analysis is an advanced method conducive to informed trading strategies adapted to a variety of market conditions.
This article was last updated on: March 28, 2026