Understanding Forex Market Basics
In the world of finance, the forex market stands out as a unique marketplace distinguished mainly by its scale, decentralization, and liquidity. Grasping the basics of this market is essential for anyone looking to identify high-probability trade setups effectively. The forex market, or foreign exchange market, is a global decentralized arena where the trading of national currencies occurs continuously during the business week. It primarily involves transactions between banks, financial institutions, corporations, governments, hedge funds, and individual traders. By understanding its foundational principles, individuals can better recognize potential patterns and trends that might influence their trading strategies.
Unlike centralized exchanges such as stock markets, forex trading takes place over-the-counter (OTC). This means transactions are conducted electronically between participants rather than through a single physical exchange. The market operates 24 hours a day, five days a week, following the major financial centers of Sydney, Tokyo, London, and New York. This continuous cycle allows traders to respond to global economic and political developments in real time.
Currencies are traded in pairs, such as EUR/USD or USD/JPY. In each pair, the first currency is the base currency, and the second is the quote currency. The exchange rate indicates how much of the quote currency is needed to purchase one unit of the base currency. Price movements reflect shifts in supply and demand, influenced by a wide range of economic, political, and psychological factors.
Liquidity in the forex market is generally high, particularly among major currency pairs like EUR/USD, GBP/USD, and USD/JPY. High liquidity often results in tighter spreads, meaning the difference between the bid and ask price is relatively small. For traders, this can reduce transaction costs and allow for quicker execution of trades. However, liquidity can vary during different trading sessions or around significant economic announcements.
Volatility is another defining feature of the forex market. While some periods are relatively stable, others can involve rapid price swings triggered by economic data releases, central bank statements, or geopolitical events. Understanding when and why volatility occurs is important for constructing high-probability trade setups that align with prevailing market conditions.
Leverage is widely available in forex trading. It allows traders to control larger positions with a relatively small amount of capital. While leverage can amplify potential returns, it also increases risk. A clear understanding of leverage and margin requirements is essential before entering trades, as small price movements can significantly impact account balances.
Developing a strong foundation in these market mechanics provides context for both technical and fundamental analysis. It enables traders to evaluate market behavior in a structured way rather than relying on assumptions or isolated signals.
Technical Analysis
One of the core methodologies for identifying high-probability trade setups in the forex market is through technical analysis. This approach focuses on historical price movements and market-generated data, such as volume and open interest, to anticipate potential future price movements. The underlying premise is that price reflects all available information and that patterns tend to repeat over time due to consistent human behavior.
Technical analysis is often implemented through charting platforms that display price data in visual formats such as candlestick charts, line charts, and bar charts. Among these, candlestick charts are particularly popular because they provide detailed information about opening, closing, high, and low prices within a specific time frame.
Chart Patterns: Chart patterns play a significant role in technical analysis, serving as visual representations that can signal potential shifts in market trends. Patterns such as head and shoulders, double tops, double bottoms, flags, wedges, and triangles are widely studied.
The head and shoulders pattern, for example, can signal a reversal of an upward trend, indicating a potential downward movement after the pattern completes. It consists of three peaks, with the middle peak being the highest. When the neckline is broken, traders often interpret this as confirmation of a trend reversal. An inverse head and shoulders pattern suggests the opposite scenario.
Double tops and double bottoms indicate that the market has tested a specific price level twice without successfully breaking through. A double top usually suggests that upward momentum has weakened and a downward move may follow. A double bottom may signal the beginning of an upward trend.
Triangle patterns, whether ascending, descending, or symmetrical, typically indicate consolidation before a breakout. An ascending triangle often forms in an uptrend and may signal continuation if price breaks above resistance. A descending triangle tends to form in a downtrend, signaling potential continuation to the downside. Symmetrical triangles can break in either direction, so traders often wait for confirmation before entering positions.
Indicators: Technical indicators are widely used to support chart-based observations. They apply mathematical calculations to price data to provide insights into trend strength, momentum, and potential reversal points.
Moving averages simplify data trends over a specific period, aiding in the identification of possible trend directions. A simple moving average (SMA) calculates the average closing price over a set number of periods. An exponential moving average (EMA) gives more weight to recent prices. Crossovers between short-term and long-term moving averages can provide signals of potential trend changes.
The Relative Strength Index (RSI) measures the speed and change of price movements. It oscillates between 0 and 100 and is often used to identify overbought conditions (above 70) and oversold conditions (below 30). When price forms a new high but RSI fails to do so, this divergence may suggest weakening momentum.
The MACD (Moving Average Convergence Divergence) indicator analyzes the relationship between two moving averages. It consists of the MACD line, signal line, and histogram. Crossovers and divergences in MACD can provide insights into potential buy or sell opportunities when short-term momentum diverges from longer-term trends.
Other indicators, such as Bollinger Bands and the Average True Range (ATR), help traders assess volatility. Bollinger Bands expand and contract based on market volatility, providing visual cues about potential breakouts. ATR measures average price range over a set period and can assist in setting stop-loss levels.
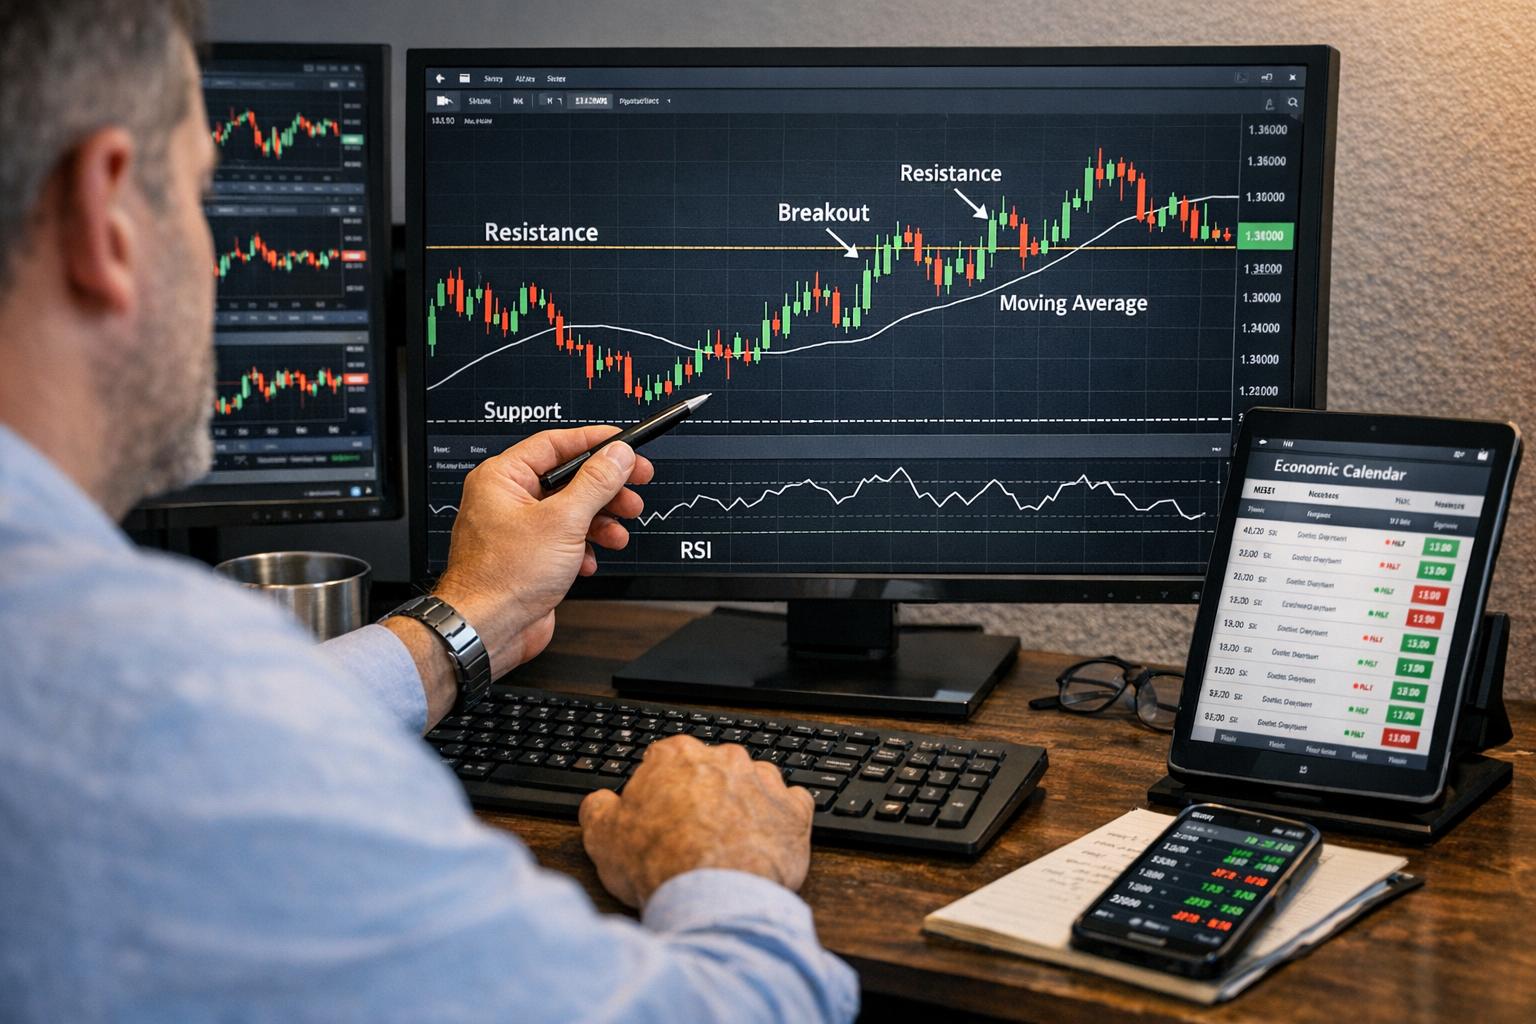
Support and Resistance Levels: Recognizing support and resistance levels on a trading chart is vital, as these levels denote prices where trends are likely to pause, consolidate, or reverse. Support levels represent price points where a currency tends to stop falling and may begin to rise due to increased buying interest. Resistance levels are points where a price rally might stall and reverse downward due to selling pressure.
These levels can be identified through historical price action, psychological round numbers, moving averages, or Fibonacci retracement levels. When price breaks above resistance or below support with strong momentum, it may indicate a potential breakout trade. However, false breakouts are possible, which is why additional confirmation methods are often used.
Market Structure and Timeframes
Understanding market structure is critical when applying technical analysis. Market structure refers to the arrangement of swings, highs, and lows that define trends. An uptrend is characterized by higher highs and higher lows, while a downtrend consists of lower highs and lower lows. A ranging market moves within horizontal support and resistance boundaries.
Analyzing multiple timeframes can improve trade selection. A trader might identify a long-term trend on a daily chart and then refine entry points on a four-hour or one-hour chart. Aligning trade direction with higher timeframe trends can increase the probability of success, as it ensures that short-term trades are not taken against broader market momentum.
Lower timeframes provide more frequent signals but may involve more noise and false moves. Higher timeframes tend to produce fewer signals but may offer more stable trend patterns. Choosing appropriate timeframes depends on trading style, whether intraday, swing, or position trading.
Fundamental Analysis
Equally important to technical analysis is fundamental analysis, which involves examining economic indicators, interest rate policies, fiscal policies, and geopolitical developments to assess currency values more comprehensively. This approach evaluates the underlying economic conditions that drive supply and demand for currencies.
Currencies are influenced by macroeconomic stability, growth prospects, and capital flows. Investors and institutions allocate funds across borders in pursuit of returns, and their decisions affect exchange rates.
Economic Indicators: Various economic indicators provide insights into a country’s economic health. Gross Domestic Product (GDP) growth rates reflect the economic output and expansion of a nation. Strong GDP growth can attract foreign investment, potentially strengthening a country’s currency.
Unemployment rates reveal labor market conditions. Lower unemployment often signals a healthy economy, while rising unemployment may indicate economic weakness. Inflation rates, commonly measured by the Consumer Price Index (CPI), have a significant impact on currency valuation. Moderate inflation may support growth, but high or unstable inflation can erode purchasing power and weaken a currency.
Other indicators include retail sales, manufacturing indices, trade balances, and consumer confidence surveys. Market participants closely monitor these releases, especially when actual figures deviate substantially from forecasts.
Central Bank Policies: Central banks manage monetary policy to achieve price stability and sustainable economic growth. Decisions regarding interest rates can create considerable volatility in forex markets. Higher interest rates tend to attract foreign capital, increasing demand for a currency. Lower rates can reduce its appeal.
Central bank communications, such as policy statements and press conferences, are closely analyzed for forward guidance. Even subtle wording changes can shift market expectations about future rate adjustments. Tools such as quantitative easing or tightening influence liquidity conditions and capital flows.
Interest rate differentials between two countries play a key role in currency pair valuations. Traders often monitor how one central bank’s policy stance compares to another’s when evaluating trade opportunities.
Using Risk Management Techniques
Identifying high-probability trade setups is only part of effective forex trading. Long-term performance depends heavily on disciplined risk management. Even well-researched trades can experience unexpected outcomes due to sudden market events.
A widely used technique is the implementation of stop-loss orders. These automatically close positions if price reaches a predefined level, limiting potential losses. Stop-loss placement is often based on technical levels, such as below support or above resistance, or calculated using volatility measures like ATR.
Position Sizing: Designing a position sizing strategy is essential for managing overall portfolio exposure. Position sizing involves determining how much capital to allocate to each trade based on account size and risk tolerance. A common approach is to risk a fixed percentage of total capital per trade, such as 1% or 2%. This method ensures that losing trades do not significantly damage overall capital.
Risk-to-reward ratios are also central to trade evaluation. A trader may seek setups where the potential reward is at least twice the potential risk. Even if not all trades are profitable, maintaining favorable risk-to-reward ratios can support overall performance over time.
Diversification across currency pairs can help reduce exposure to a single economic event. However, traders must consider correlations, as some currency pairs move similarly due to shared economic influences.
Developing a Trading Plan
The cornerstone of consistent forex trading is a clearly defined trading plan. A structured plan outlines criteria for trade selection, entry timing, exit strategy, and risk parameters. It also defines preferred trading sessions, timeframes, and currency pairs.
A trading plan typically specifies conditions under which trades will be taken, such as alignment between trend direction and indicator confirmation. It describes how stop-loss levels and profit targets are determined. By documenting these elements, traders reduce the likelihood of impulsive decisions.
Maintaining a trading journal can support plan adherence. Recording trade rationales, outcomes, and observations helps identify strengths and weaknesses in strategy application. Over time, this data can be reviewed to refine methods and improve consistency.
Consistency does not imply rigidity. Market conditions evolve, and strategies may require adjustment. Periodic review ensures that trading approaches remain aligned with prevailing volatility, liquidity, and macroeconomic conditions.
By integrating technical and fundamental analyses with structured risk management practices and a carefully developed trading plan, forex traders can enhance their ability to discern and act on high-probability trade setups. This comprehensive framework provides a systematic method for navigating the complexities of the forex market while maintaining controlled exposure to risk. For additional insights into developing and refining trading strategies, consider exploring resources such as an informative trading strategy guide.
This article was last updated on: March 28, 2026