Understanding Fibonacci Retracement Levels
Fibonacci retracement levels are a widely used tool in the realm of technical analysis within forex day trading. Originating from the famed Fibonacci sequence, this tool leverages a series of numbers known for their unique mathematical properties and geometric connections. In trading terms, these retracement levels are pivotal in pinpointing potential support and resistance levels within price charts, providing traders with insights into potential market reversals.
The Fibonacci sequence begins with 0 and 1, and each subsequent number is the sum of the two preceding numbers. As the sequence progresses, ratios derived from it begin to converge toward specific constants. Among these, the most recognized in financial markets is 61.8%, often referred to as the “golden ratio.” Other derived ratios, such as 38.2% and 23.6%, are also widely applied. Over time, traders have adapted these mathematical relationships into practical charting tools designed to measure retracements within trending markets.
In forex markets, where price movement is continuous and influenced by global macroeconomic flows, identifying structured reference points can assist traders in organizing their analysis. Fibonacci retracement levels offer a method of framing pullbacks within broader directional moves. Rather than predicting price with certainty, the tool helps identify areas where reactions may occur based on historical proportional relationships.
The Basics of Fibonacci Retracement
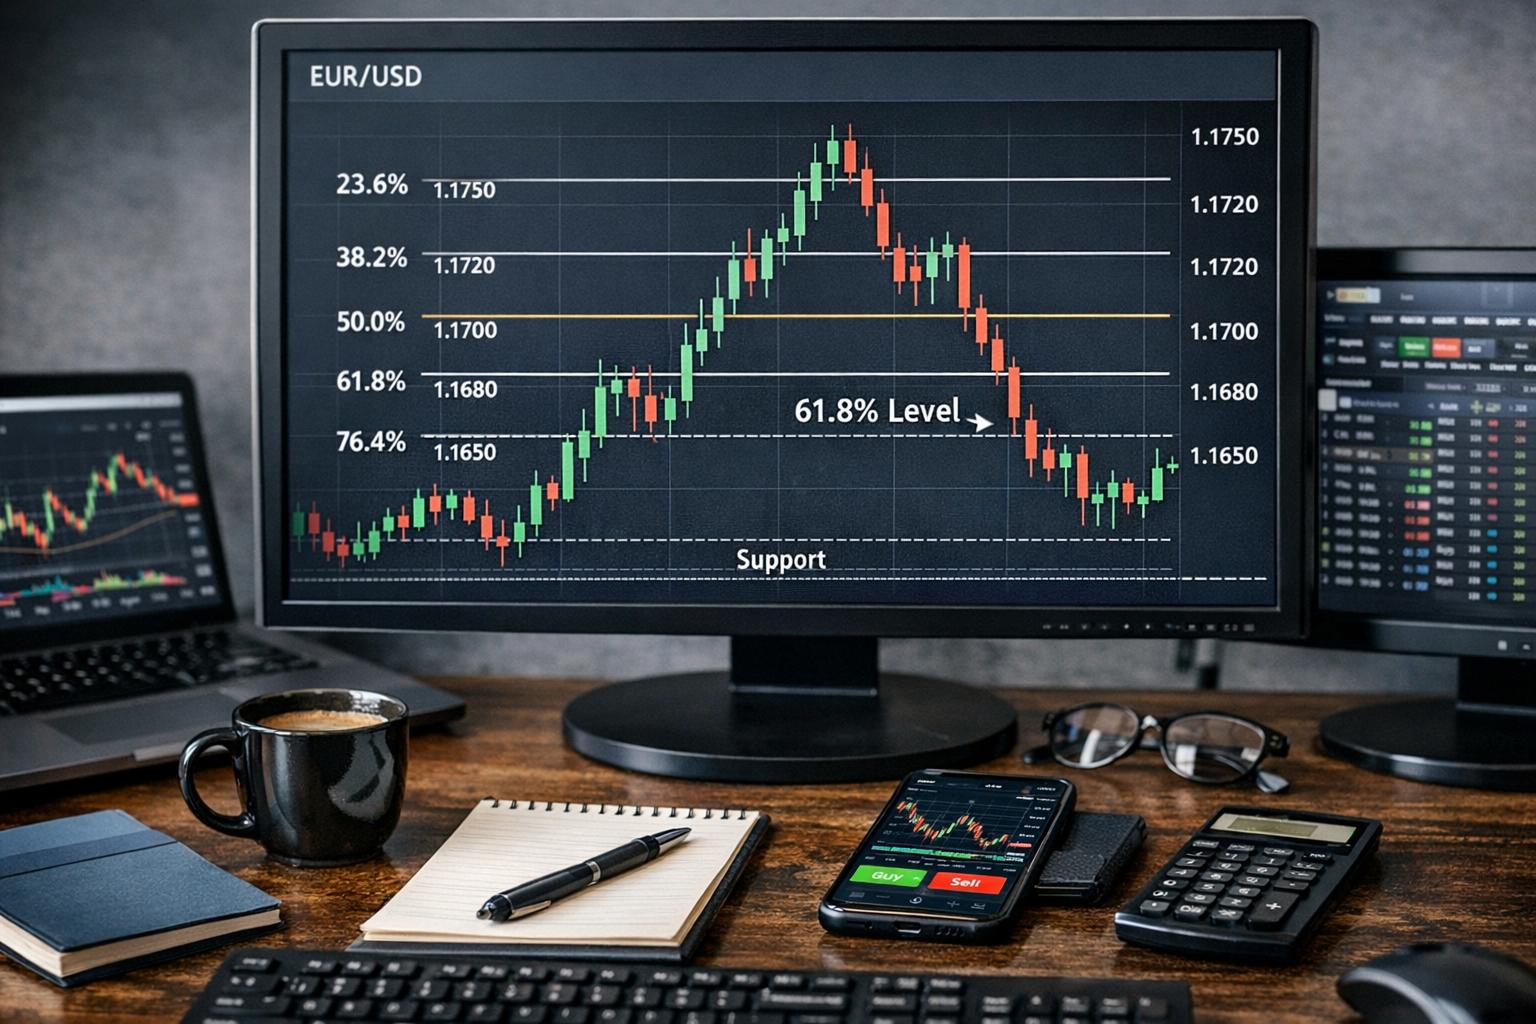
The essence of Fibonacci retracement lies in its deployment of horizontal lines to denote possible reversal levels. Traders commonly recognize several key levels, including 23.6%, 38.2%, 50%, 61.8%, and 100%. These percentages represent the extent of a prior move retraced by the current price level. By observing how price behaves near these levels, traders attempt to evaluate whether the market is likely to resume the original trend or transition into a deeper correction.
Among these levels, 38.2% and 61.8% are frequently monitored because they often align with areas where market participants reassess positions. The 50% level, while not a true Fibonacci ratio, has been incorporated due to its longstanding presence in Dow Theory and its frequent appearance in price corrections. The 23.6% retracement is typically considered shallow and often seen in strong trending environments, while the 61.8% level represents a deeper pullback that may still preserve the integrity of a prevailing trend.
The reason these levels attract attention lies not in inherent predictive power but in collective observation. When many traders monitor identical price thresholds, those areas can become self-reinforcing zones of activity. Institutional traders, retail participants, and algorithmic systems may all incorporate Fibonacci-derived inputs, contributing to observable reactions around these levels.
Retracements differ from reversals. A retracement is a temporary counter-trend movement, while a reversal indicates a broader change in direction. Fibonacci retracement aims to measure the former. By quantifying how much of an existing move has been retraced, traders can better assess whether a trend remains structurally intact.
Drawing Fibonacci Retracement Correctly
Accurate application begins with identifying a clear directional swing. In an uptrend, the retracement tool is drawn from a significant low to a significant high. In a downtrend, it is drawn from a significant high to a significant low. The definition of “significant” often depends on timeframe and trading style. Day traders might focus on intraday swing points visible on a 15-minute or hourly chart, while swing traders might reference daily highs and lows.
Price swings used for Fibonacci measurement should represent meaningful momentum-driven moves rather than minor fluctuations. Selecting inconsistent anchors can distort retracement levels and reduce their analytical value. Consistency in identifying swing highs and lows enhances reliability over time.
For instance, following a noticeable uptrend, the Fibonacci tool is drawn from the lowest point preceding the move to the highest point achieved before the pullback begins. The plotted retracement levels then appear below the high, indicating potential support zones. Conversely, in a downtrend, the tool is drawn from the highest point to the lowest, with retracement levels plotted above price to indicate possible resistance areas.
Most charting platforms automatically calculate and display these levels once the anchors are selected. Traders may customize which ratios appear, adding levels such as 78.6% or removing less-used ratios depending on their approach.
Using Fibonacci Retracements in Forex Day Trading
The application of Fibonacci retracement levels in forex trading starts with identifying a prominent peak and trough on a forex chart. These points serve as the foundation for drawing Fibonacci retracement lines. When plotted, traders inspect price interaction with these levels to detect signs of support or resistance emerging.
In day trading, time sensitivity is critical. Retracement levels may form and resolve within hours. Currency pairs such as EUR/USD, GBP/USD, and USD/JPY often exhibit structured intraday swings that lend themselves to Fibonacci analysis. When price approaches a retracement level, traders monitor candlestick formations, momentum oscillators, and order flow signals for confirmation.
If price retraces to 38.2% and forms consolidative candles with declining volume, for example, this may indicate temporary equilibrium before continuation. Alternatively, if price penetrates the 61.8% retracement with strong momentum, traders may interpret this as potential structural weakness in the prior trend.
Forex markets operate twenty-four hours a day during the trading week, meaning retracement behavior can vary significantly across sessions. The London and New York sessions tend to produce higher volatility and cleaner directional movement. Fibonacci levels drawn from session highs and lows often become reference points during these active trading windows.
Psychological and Market Structure Foundations
Fibonacci retracement is partly grounded in behavioral finance principles. Markets frequently move in waves driven by collective positioning, profit-taking, and re-entry. When traders exit positions to secure gains, price retraces part of its move. If broader sentiment remains intact, new participants may enter at perceived value zones, reinforcing the original direction.
The 61.8% retracement, in particular, often marks a threshold where market participants reassess conviction. A shallow retracement may suggest strong trend commitment, while a deeper retracement indicates more substantial counter-pressure. Observing how price reacts near these ratios offers clues regarding participant positioning.
Market structure complements Fibonacci usage. Higher highs and higher lows define an uptrend, while lower highs and lower lows define a downtrend. Retracements that respect Fibonacci levels while maintaining structural integrity may strengthen the case for continuation. Conversely, violations of key structural points can signal possible reversals.
Strategies Involving Fibonacci Retracement
While Fibonacci retracement levels provide insight into potential market reversals or continuations, their effectiveness often improves when combined with other technical tools. Integration reduces reliance on a single metric and broadens analytical perspective.
Trend Confirmation: Utilizing Fibonacci levels alongside traditional trendlines often provides verification of potential movements. If a retracement level coincides with a well-respected ascending trendline, the overlap increases analytical significance. Alignment between a 61.8% retracement and a long-standing support line, for example, may draw attention from multiple forms of market analysis.
Confluence: Situations where multiple analytical elements align at the same price area are described as confluence zones. A Fibonacci level overlapping with a moving average, horizontal historical support, or pivot point creates layered significance. Traders often prioritize these zones over isolated levels because of their increased probability of market reaction.
Momentum Integration: Oscillators such as the Relative Strength Index (RSI) or stochastic indicators can help assess whether a retracement aligns with overbought or oversold conditions. If price reaches a 38.2% retracement while RSI resets from overbought territory in an uptrend, this alignment may reinforce continuation bias.
Price Action Signals: Candlestick structures at Fibonacci levels provide additional context. Pin bars, engulfing formations, and inside-bar consolidations occurring at retracement zones can help refine entry timing. Rather than entering solely because price reaches a level, traders often wait for behavioral confirmation.
Fibonacci Extensions and Targets
Beyond retracements, Fibonacci tools also include extension levels. Extensions project potential profit targets once a retracement concludes and the trend resumes. Common extension ratios include 127.2%, 161.8%, and 261.8%. These are derived from the same mathematical relationships as retracement levels.
In practice, a trader might enter during a pullback at 50% or 61.8% and project an extension level beyond the prior high or low as a structured exit point. Extension targets help quantify reward expectations and maintain disciplined trade management.
Timeframe Considerations
Fibonacci retracement levels behave differently across timeframes. Levels drawn on daily charts often carry broader significance and may act as structural zones for weeks or months. Intraday levels may be more reactive but less durable.
Multi-timeframe analysis can enhance understanding. A 38.2% retracement on a daily chart aligning with a 61.8% retracement on a four-hour chart creates layered analysis. This overlap can help day traders align shorter-term trades with longer-term directional context.
However, overcrowding a chart with multiple Fibonacci grids can reduce clarity. Maintaining focus on the most relevant swing structure ensures analytical discipline.
Risk Management and Practical Considerations
Despite its usefulness, Fibonacci retracement is not flawless. Financial markets are influenced by economic releases, geopolitical developments, and unexpected liquidity shifts. Sudden volatility can cause price to move decisively through retracement levels without respect for prior ratios.
Effective risk management remains essential. Traders commonly place stop-loss orders beyond the next retracement level or outside recent structural highs or lows. Position sizing should reflect volatility conditions and overall account exposure.
It is also important to avoid forcing Fibonacci analysis onto unclear price action. In ranging environments without defined swings, retracement grids may offer limited value. Waiting for clear impulsive moves before applying the tool often produces more consistent results.
Proficiency with Fibonacci retracement develops through repetition and structured review. Traders benefit from examining historical charts to observe how different currency pairs react to retracement levels under varying volatility regimes. Supplementing practical study with further reading can broaden theoretical understanding.
Record-keeping supports refinement. Documenting how price responded at specific Fibonacci levels, including contextual indicators present at the time, enables data-driven evaluation of effectiveness. Over time, this process clarifies which ratios and combinations align best with a trader’s methodology.
In conclusion, Fibonacci retracement levels serve as structured reference tools for evaluating pullbacks within trending forex markets. Their value lies in organizing price movement into measurable proportions and identifying areas where market reactions may occur. While widely adopted, they are most effective when integrated with broader technical frameworks, sound risk management, and consistent practice. Understanding these levels enhances analytical structure, but disciplined execution and confirmation remain central to sustained trading performance.
This article was last updated on: March 28, 2026