Understanding Currency Pair Correlations
Understanding currency pair correlations is a fundamental aspect for traders aiming to optimize their trading strategies. Currencies rarely move in isolation; their interactions create a network of relationships shaped by global trade flows, interest rate differentials, geopolitical events, and macroeconomic cycles. When traders analyze only a single pair in isolation, they may overlook broader exposures embedded within their portfolio. A structured understanding of correlations provides a wider analytical lens, enabling market participants to evaluate how positions interact with one another.
Foreign exchange markets operate as an interconnected system in which each currency reflects not only domestic economic performance but also relative strength against another economy. Because currencies are quoted in pairs, every transaction inherently involves two economies. As a result, correlations emerge naturally, reflecting common drivers such as commodity dependence, monetary policy trends, or shared geographic or trade relationships. Recognizing these statistical interdependencies contributes to more informed position sizing, portfolio construction, and strategic planning.
What Are Currency Pair Correlations?
Currency pair correlations refer to the statistical relationships between the price movements of two different currency pairs. When two pairs move in the same direction over a specified time frame, they are classified as positively correlated. For instance, if the EUR/USD and GBP/USD pairs both rise simultaneously during a given period, they are demonstrating positive correlation. In contrast, when one currency pair tends to rise while another falls, they exhibit negative correlation.
These relationships are quantified using correlation coefficients, measured on a scale from -1 to +1. A reading of +1 represents perfect positive correlation, where two pairs move in complete alignment. A reading of -1 reflects perfect negative correlation, meaning the pairs move in exact opposition. A value near zero indicates little to no measurable relationship. In practical market conditions, correlations rarely remain fixed at extreme values. Instead, they fluctuate within ranges that reflect changing economic dynamics.
It is important to distinguish between correlation and causation. Correlation measures the degree to which two pairs move together, but it does not explain why they do so. For example, EUR/USD and GBP/USD may exhibit strong positive correlation because both incorporate the US dollar as the quote currency. Movements driven by US economic data can simultaneously affect both pairs. However, this shared movement does not mean one pair determines the movement of the other. It simply indicates common underlying influences.
Types of Correlation in the Forex Market
Correlation analysis in currency markets typically distinguishes between positive correlation, negative correlation, and no meaningful correlation. These distinctions provide clarity regarding exposure concentration and diversification effectiveness.
Positive Correlation
Positively correlated pairs move in the same direction with varying strength. A common example includes EUR/USD and GBP/USD. Both pairs often respond similarly to US dollar strength or weakness. If the Federal Reserve adjusts interest rates or releases significant economic data, the impact may drive both pairs in the same direction. Traders holding long positions in both pairs should understand that such exposure may amplify risk if the US dollar strengthens unexpectedly.
Negative Correlation
Negative correlation occurs when two pairs generally move in opposite directions. A frequently cited relationship exists between EUR/USD and USD/CHF. Since the US dollar is positioned differently in each pair, movements in the dollar can push the pairs in opposite directions. When traders hold positions in negatively correlated pairs, potential losses in one position may be partially offset by gains in the other, depending on the strength of the correlation.
Low or Variable Correlation
Some currency pairs exhibit weak or inconsistent relationships. For example, AUD/JPY and GBP/CHF may not demonstrate a stable pattern of interaction because they are influenced by distinct regional and economic drivers. Low correlation can improve diversification if the independence of movement is maintained over time.
Why Are Correlations Important?
The significance of understanding currency pair correlations in trading involves several practical benefits, primarily rooted in diversification, risk management, strategic hedging, and capital allocation efficiency. Traders who neglect correlations may expose themselves to unintended concentrations of risk.
Improving Portfolio Diversification
A thorough grasp of correlations is indispensable when it comes to portfolio diversification. Diversification involves spreading capital across assets that do not respond identically to the same stimuli. In currency trading, this process requires identifying pairs that maintain low or negative correlation over relevant time frames.
For instance, constructing a portfolio that includes EUR/USD, GBP/USD, and AUD/USD may appear diversified because three different pairs are involved. However, since all three contain the US dollar as the quote currency, they may respond similarly to US-driven developments. The result could be concentrated exposure rather than genuine diversification. A more diversified approach might include incorporating pairs influenced by different economic regions or commodity cycles.
Effective diversification through correlation analysis helps stabilize performance by reducing the likelihood that all positions move adversely at the same time. While diversification does not eliminate risk, it can reduce portfolio volatility.
Enhancing Risk Management
Correlations play a central role in comprehensive risk management. Exposure in the forex market should be evaluated not only on a per-trade basis but also at the aggregate portfolio level. Opening multiple positions in highly correlated pairs effectively increases position size relative to one underlying driver.
Consider a trader who enters long positions in EUR/USD and GBP/USD simultaneously. If both pairs have a strong positive correlation and the US dollar strengthens broadly, both positions may move against the trader. The cumulative drawdown may exceed expectations if correlation was not considered during position planning.
Conversely, awareness of negative correlation can be used to structure offsetting positions, though such strategies require careful analysis. Overreliance on historical negative correlations without monitoring changing market conditions can introduce unexpected residual risks.
Boosting Profitability Through Relative Value Analysis
Beyond defensive risk control, correlations can assist in identifying strategic opportunities. When two historically correlated pairs temporarily diverge beyond their typical statistical range, traders may analyze whether the divergence reflects new fundamental information or short-term imbalance.
Some participants use correlation analysis to develop relative value strategies. If EUR/USD and GBP/USD maintain a high historical correlation but temporarily decouple, a trader might evaluate macroeconomic developments to determine whether the divergence is justified. If not, the expectation of reversion may inform trade planning. This approach requires disciplined quantitative analysis and awareness of transaction costs.
Time Frames and Dynamic Nature of Correlations
Correlation coefficients vary depending on the time frame analyzed. Short-term correlations measured over days may differ markedly from long-term correlations measured over months. For example, intraday flows driven by technical positioning can briefly distort otherwise stable relationships.
Traders must therefore specify the observation period when evaluating correlations. A 30-day rolling correlation may offer insight into recent relationships, while a 12-month measurement provides perspective on structural alignment. Monitoring changes across multiple horizons supports a more comprehensive assessment.
Importantly, correlations are dynamic rather than fixed. Shifts in monetary policy, fiscal stimulus programs, geopolitical tensions, commodity price cycles, and global risk sentiment can alter relationships between currency pairs. For example, during periods of global financial stress, certain currencies may strengthen broadly as capital flows toward perceived safety. In calmer periods, interest rate differentials may dominate movement.
Fundamental Drivers of Currency Correlations
Several macroeconomic forces underpin currency pair correlations. Understanding these drivers improves interpretation of statistical readings.
Interest Rate Differentials
Interest rates influence capital flows across borders. When two economies adjust rates in similar directions, their currencies may exhibit aligned movement against third currencies. If central banks diverge in policy stance, correlations may weaken or reverse.
Commodity Dependencies
Commodity-linked currencies often share correlation due to exposure to global resource demand. For instance, countries reliant on exports of oil, metals, or agricultural goods may see their currencies respond to shifts in commodity prices. If multiple commodity-exporting economies experience similar trade impacts, correlations may strengthen among their currency pairs.
Trade Relationships
Strong bilateral trade relationships can influence correlated movement. Economies deeply integrated through supply chains and cross-border investment often experience related economic cycles. This interconnectedness may manifest in correlated exchange rate fluctuations.
Global Risk Sentiment
Periods of heightened uncertainty can produce uniform shifts in investor positioning. Capital may move collectively into or out of specific currencies perceived as higher or lower risk. Such broad sentiment-driven flows can temporarily increase correlations across otherwise distinct pairs.
How to Measure Correlations
Measuring currency pair correlations is typically accomplished using statistical software, spreadsheet calculations, or built-in trading platform tools. The Pearson correlation coefficient is the most common measurement approach. It compares historical price returns of two currency pairs over a defined number of periods.
The formula itself involves computing covariance between the returns of two pairs and dividing it by the product of their standard deviations. Although manual calculation is possible, most traders rely on charting software or analytical tools to automate the process.
Utilizing Trading Platforms
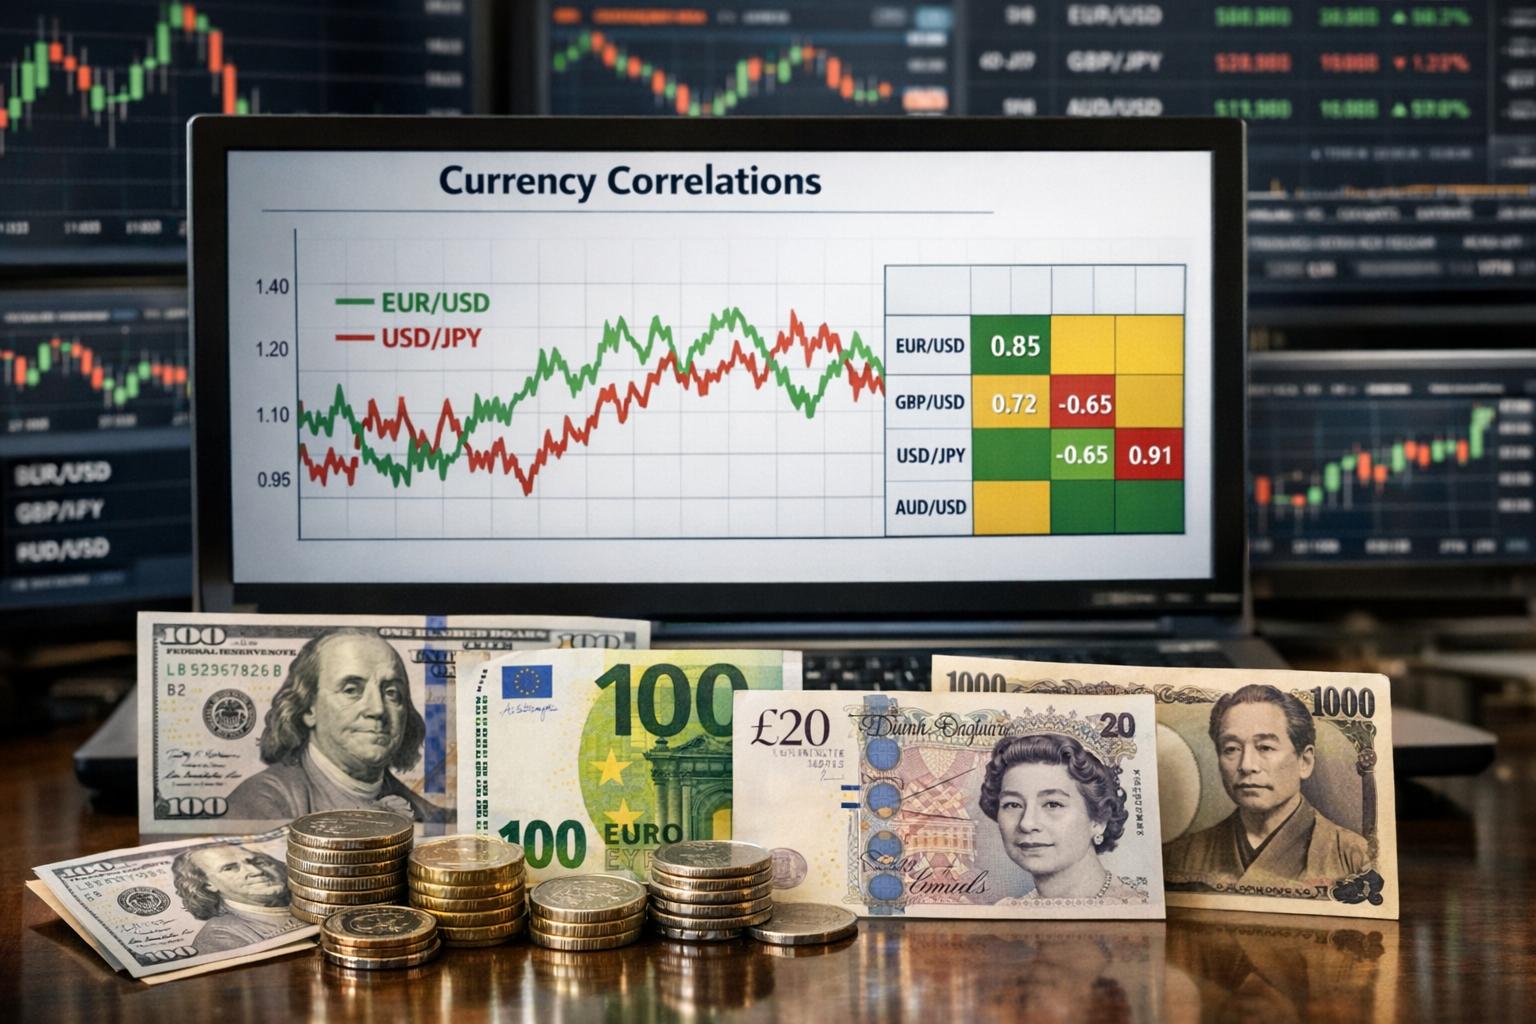
Modern trading platforms often include correlation matrices or indicators that allow traders to compare multiple pairs simultaneously. These matrices display correlation values across rows and columns, offering a consolidated overview of interrelationships.
Platforms may allow adjustment of the lookback period, enabling traders to evaluate both short-term and long-term relationships. Some systems also provide visual heat maps that differentiate strong positive and negative correlations through color coding. While such visual aids improve accessibility, interpretation still requires contextual understanding of macroeconomic developments.
Traders should verify whether correlation data reflects closing prices, hourly returns, or another timeframe. Differences in data frequency can materially affect resulting coefficients. Cross-checking across intervals reduces the likelihood of basing decisions on distorted readings.
Applying Correlation Analysis to Trade Planning
In practical application, correlation analysis supports several strategic processes. Position sizing becomes more precise when adjusted for correlated exposure. Rather than assigning identical risk percentages to multiple positions without context, traders can scale exposure based on interdependence.
Correlation awareness also informs stop-loss and take-profit placement. If two open trades are positively correlated, adverse movement in one may indicate developing weakness in the other. Monitoring such patterns can improve responsiveness to shifting market conditions.
Additionally, traders may avoid duplicative positions. Instead of opening trades in several highly correlated pairs that reflect the same directional thesis, they may select a single pair offering optimal liquidity or technical structure. This reduces transaction costs and administrative complexity.
Limitations of Correlation Analysis
While correlation analysis offers valuable guidance, it has limitations. First, correlations are backward-looking measurements derived from historical data. They do not guarantee future relationships. Structural market shifts, unexpected geopolitical events, and regime changes in monetary policy can rapidly alter established patterns.
Second, correlation does not measure magnitude of movement. Two pairs may move in the same direction but with significantly different volatility profiles. A moderate correlation does not imply equal percentage changes.
Third, statistical noise can distort short-term readings. Temporary liquidity imbalances or isolated political developments may weaken correlation temporarily without signaling long-term change.
Finally, overemphasis on correlation may lead traders to avoid valid opportunities unnecessarily. Correlation analysis should complement, rather than replace, fundamental and technical evaluation.
Conclusion
Comprehending and applying knowledge of currency pair correlations is a critical component in the formulation of a structured trading strategy. Correlations illuminate hidden linkages between positions, clarify aggregate exposure, and support both defensive and opportunistic decision-making.
However, these relationships are not static. They evolve in response to macroeconomic cycles, interest rate trajectories, commodity price shifts, geopolitical developments, and changing global capital flows. Effective traders monitor correlation trends regularly, adjusting exposure as conditions shift.
Incorporating correlation analysis into standard evaluation processes promotes more coherent portfolio construction and disciplined risk control. When integrated with sound fundamental research, technical analysis, and prudent money management, correlation awareness enhances a trader’s ability to manage complexity within the interconnected global foreign exchange market.
This article was last updated on: March 28, 2026