Understanding Fibonacci Retracement Levels
In the realm of forex day trading, technical analysis tools are essential for making informed decisions. Among these, Fibonacci retracement levels stand out as a notable resource. Based on the renowned Fibonacci sequence, these mathematical calculations are not just abstract figures but are representative of potential support and resistance areas on a trading chart. This specificity allows traders to gauge possible entry and exit points for their trades, thereby enhancing their overall trading strategy.
Technical analysis in the foreign exchange market often relies on identifying patterns that repeat over time. Price movements, while influenced by economic fundamentals, frequently display structured swings that can be measured and evaluated. Fibonacci retracement levels help traders quantify these swings. Rather than guessing where a correction might end, traders apply a systematic framework derived from consistent numerical relationships.
The appeal of Fibonacci retracement levels lies in their adaptability. They can be applied across timeframes, from one-minute charts used by scalpers to daily or weekly charts used by swing traders. This flexibility makes them particularly useful in forex day trading, where rapid price fluctuations require structured reference points.
What are Fibonacci Retracement Levels?
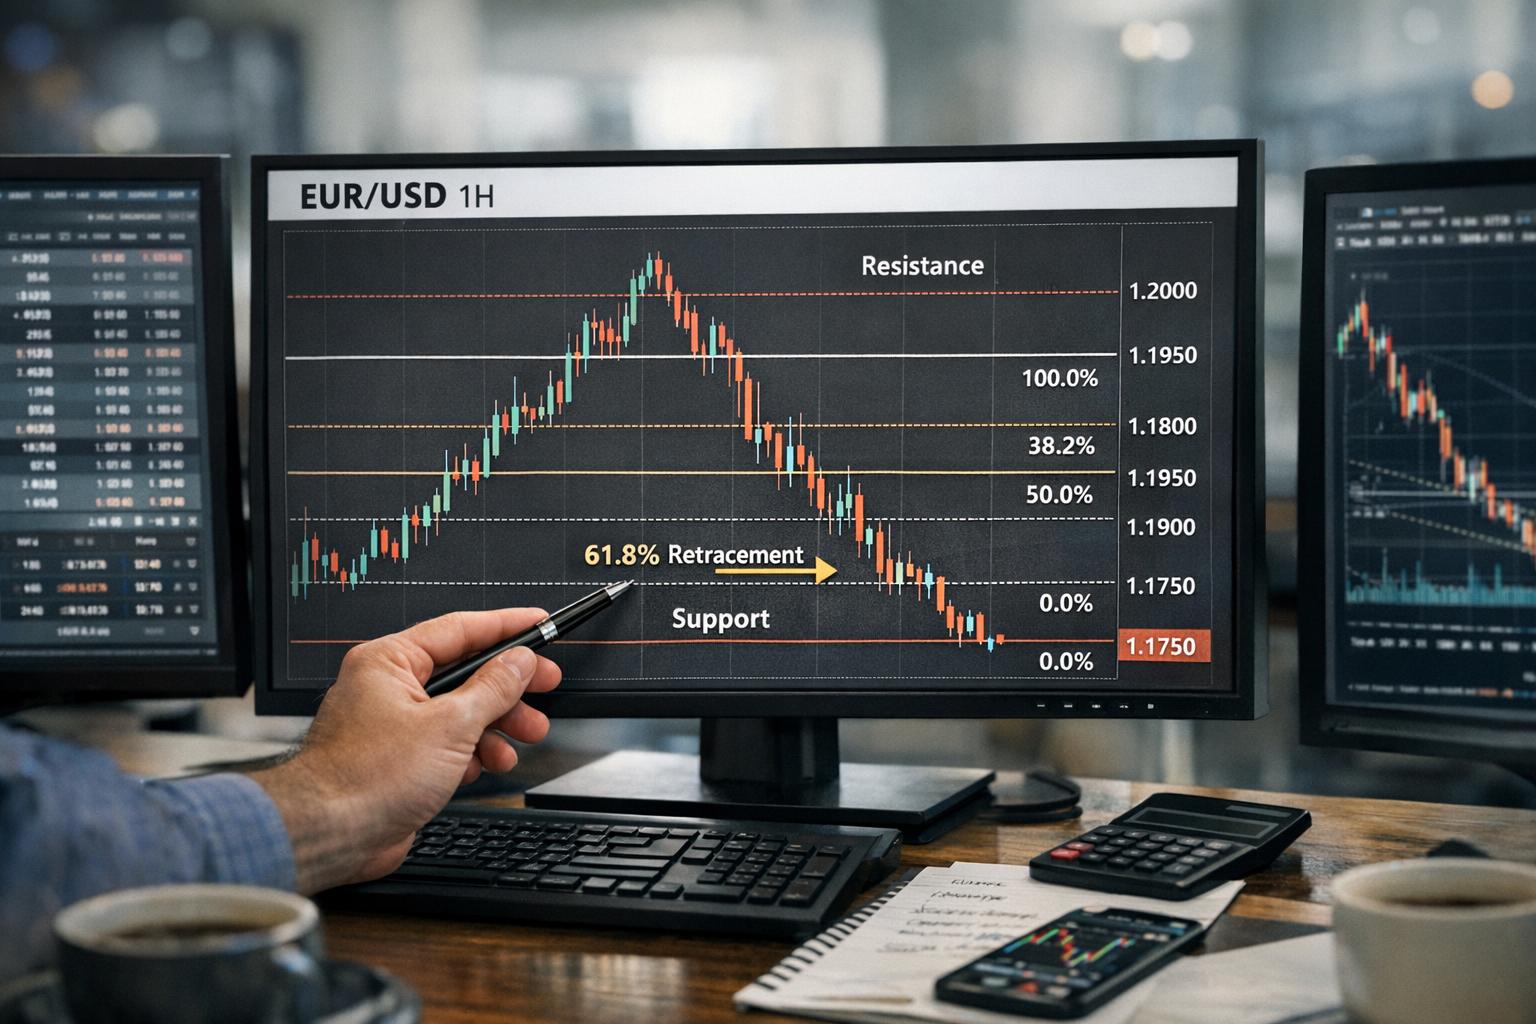
Fibonacci retracement levels are essential horizontal lines that portray possible reversal or continuation areas in price movements within the forex market. These levels, derived from the Fibonacci sequence, relate to key ratios of 23.6%, 38.2%, 50%, 61.8%, and 100%. Traders typically draw these levels between two significant points, often a peak and a trough in pricing, and utilize them to make informed predictions about future price actions.
The Fibonacci sequence itself begins with 0 and 1, and each subsequent number is the sum of the two preceding numbers. As the sequence progresses, certain ratios appear consistently. The most widely recognized is 61.8%, often referred to as the golden ratio. When one number in the sequence is divided by the next, the result approximates 0.618. Dividing a number by one two places to the right approximates 0.382. These ratios form the foundation of Fibonacci retracement analysis.
The inclusion of the 50% level, although not mathematically derived from the Fibonacci sequence, is rooted in Dow Theory and broad market observation. Many financial markets tend to retrace roughly half of a prior move before resuming the trend. Because of its widespread use, the 50% level is commonly included alongside Fibonacci-derived ratios.
When plotted on a chart, these percentages represent the portion of a price move that has been retraced. For example, if a currency pair rises from 1.1000 to 1.1200, a 50% retracement would occur at 1.1100. These calculated levels offer structured areas where buying or selling interest may emerge.
How to Draw Fibonacci Retracement Levels
The initial step in deploying Fibonacci retracement levels is drawing them accurately on the price chart. Here is an expanded methodology that can aid traders:
Identify Key Price Points: Begin by pinpointing a noteworthy high and low in recent price movements. These points provide the boundaries within which the Fibonacci retracement levels will be drawn.
Selecting appropriate swing points is critical. A swing high typically occurs where price makes a peak before reversing downward, while a swing low forms at the lowest point before price reverses upward. Traders often look for clear visual turning points rather than minor fluctuations. On lower timeframes, identifying these swings requires attention to recent volatility and price structure.
Select the Correct Tool: Access the Fibonacci retracement tool available on the trading platform being used. This tool is essential for plotting the desired levels accurately.
Most modern trading platforms provide a built-in Fibonacci retracement function. Traders should ensure they choose the correct variation, as platforms may also offer Fibonacci extensions, arcs, and fans. For retracement purposes, the standard horizontal retracement tool is used.
Plotting with Precision: In a downtrend scenario, click on the high and drag the tool down to the low. Conversely, in an uptrend, you would start from a low and drag up to the high. The tool will then generate the Fibonacci retracement levels automatically between these selected points, marking areas that might exhibit significant price reactions.
Accuracy in plotting ensures that the retracement levels align correctly with the price swing being analyzed. Some traders prefer to use closing prices when defining swing highs and lows, while others rely on candle wicks. Consistency in approach is important to maintain analytical discipline.
After plotting, the retracement lines appear as horizontal levels across the chart. These lines serve as guides rather than fixed barriers. Price may approach, slightly exceed, or briefly penetrate a level before reversing.
Using Fibonacci Retracement in Forex Day Trading
Employing Fibonacci retracement levels is a strategic move in forex trading. By highlighting potential areas of interest on the chart, these levels guide traders on where to initiate trades, position stop-loss orders, and set their take-profit targets.
Day traders in particular benefit from this structure because intraday volatility can create frequent pullbacks within broader trends. Rather than entering a trade impulsively, traders can wait for price to retrace to a predefined level. This approach can improve trade placement and risk-to-reward ratios.
When used systematically, Fibonacci retracement offers a framework for planning trades before they occur. Traders can map potential scenarios such as shallow pullbacks to 23.6% during strong trends or deeper corrections to 61.8% during consolidating markets.
Identifying Potential Reversal Levels
As prices move in a distinct trend, be it ascending or descending, traders vigilantly observe retracement levels as they indicate zones where a price correction might manifest. If the price retraces to a specific Fibonacci level and stabilizes there, it is classified as a potential reversal point. For instance, amidst an upward market trend, a retracement back to the 38.2% or 50% level could flag a new buying opportunity worth consideration.
The strength of the prior trend influences which retracement level may hold. In strong, momentum-driven markets, retracements may be shallow, respecting the 23.6% or 38.2% level before continuing. In slower or corrective environments, price may drift toward the 61.8% level before resuming direction.
Traders often wait for confirmation before entering at a retracement level. Confirmation may include candlestick formations such as engulfing patterns or pin bars that signal rejection of the level. Volume analysis, if available, can also support the assessment of whether buyers or sellers are defending the area.
Determining Support and Resistance
The functionality of Fibonacci levels extends to acting as prospective support or resistance levels. In upward trends, levels such as 23.6%, 38.2%, and 61.8% serve as potential support where the price might rebound upward following a retracement. Conversely, in descending trends, these levels form probable resistance points, hindering the price from advancing further.
Support and resistance derived from Fibonacci differ slightly from traditional horizontal support and resistance. Traditional levels are usually drawn based on prior highs and lows. Fibonacci levels, by contrast, are mathematically projected within a measured move. When both methods align at the same price zone, the area may gain additional attention from traders.
Price does not always reverse precisely at a Fibonacci level. Instead, zones form around these percentages. Traders often consider a small range above and below each line to account for market noise. This practical adjustment reflects the reality that forex markets are highly liquid and subject to rapid fluctuations.
Using Fibonacci with Other Indicators
Although potent on their own, the effectiveness of Fibonacci levels is further amplified when used in conjunction with additional technical indicators. Traders commonly integrate them with moving averages, trend lines, and candlestick patterns to affirm potential trading scenarios. For instance, alignment of a Fibonacci retracement level with a trend line or a moving average could underscore that level as a noteworthy zone within the trading context.
Moving averages help define the prevailing trend. If a 61.8% retracement aligns with a widely observed moving average, such as the 50-period or 200-period average, traders may interpret the area as technically significant. Similarly, if a Fibonacci level coincides with a previously broken support or resistance zone, the convergence strengthens the analytical case.
Oscillators such as the Relative Strength Index (RSI) may also complement Fibonacci analysis. If price reaches a retracement level while the RSI indicates oversold conditions in an uptrend, the combined signals may suggest a higher probability of reversal. The key principle is confluence, where multiple forms of analysis point toward the same area of interest.
Advanced Applications of Fibonacci Retracement
Beyond basic retracement analysis, traders expand Fibonacci concepts to enhance precision. One approach involves analyzing multiple timeframes. A retracement level on a higher timeframe, such as the four-hour chart, may overlap with a level drawn on a lower timeframe, such as the fifteen-minute chart. When such overlaps occur, the zone may carry greater technical importance.
Another application is the use of Fibonacci clusters. Traders draw retracements across several recent swings and identify areas where multiple Fibonacci levels cluster together. These clusters may indicate stronger areas of support or resistance compared to isolated levels.
Fibonacci retracement can also support measured move analysis. If price retraces to 50% and resumes direction, traders may anticipate that the next movement could mirror the magnitude of the preceding impulse. Although not guaranteed, this structured expectation assists in setting realistic profit targets.
Risk Management Considerations
Risk management remains central to effective use of Fibonacci retracement levels. While these levels identify potential reversal areas, they do not guarantee precise turning points. Traders typically place stop-loss orders beyond the next logical Fibonacci level or beyond the original swing point.
For example, in an uptrend where a trader enters near the 38.2% retracement, a stop-loss might be placed slightly below the 61.8% level or below the original swing low. This positioning allows the trade room to fluctuate while still defining a clear invalidation point.
Position sizing also plays a role. Traders calculate trade exposure relative to account equity to ensure that no single trade significantly impacts overall capital. Fibonacci retracement helps define entry and stop levels, which in turn determine appropriate lot size based on predetermined risk parameters.
Common Mistakes When Using Fibonacci Retracement
Several common errors can reduce the effectiveness of Fibonacci retracement strategies. One recurring issue is drawing retracements from insignificant price swings. Minor fluctuations may not attract sufficient market participation to validate retracement levels.
Another mistake involves overreliance on a single level. Markets can temporarily breach a Fibonacci ratio before reversing. Assuming that a level will hold without confirmation can lead to premature entries.
Inconsistent methodology also affects results. Switching between wick-based and body-based swing points without clear rules can produce varying retracement levels. Establishing and adhering to a consistent drawing method enhances analytical clarity.
Finally, ignoring broader market context diminishes reliability. Economic announcements, central bank decisions, and geopolitical developments can override technical structures. Traders should remain aware of scheduled news events that may influence currency volatility.
Limitations and Considerations
While Fibonacci retracement levels are undoubtedly a valuable analytical tool, traders must exercise caution because they are not infallible. Various market conditions, such as high volatility or unforeseen news events, can incite price shifts beyond these established levels. Therefore, it is imperative for traders to utilize these levels alongside alternative analytic techniques and employ prudent risk management practices to safeguard their trading undertakings.
Fibonacci retracement is inherently reactive rather than predictive. It measures past price movement and projects proportional corrections. It does not independently determine the strength of buyers or sellers in future sessions. As a result, it performs best in structured trending environments rather than erratic range-bound markets.
Market psychology also plays a role in its effectiveness. Because many traders monitor the same levels, self-fulfilling behavior can occur. If enough participants anticipate a reaction at 61.8%, collective order flow may contribute to a temporary reversal. However, if institutional activity overrides retail positioning, price may continue beyond the level.
Final Thoughts
Fibonacci retracement levels offer profound insights into market dynamics and trading behaviors. Understanding how to accurately draw and interpret these levels is crucial for traders aspiring to make informed choices within their day trading strategies. As such, many trading platforms provide comprehensive guides and tools to assist traders in mastering the application of Fibonacci retracement levels, thus empowering them to leverage this analytical technique effectively in their trading endeavors.
By integrating Fibonacci retracement into a structured trading plan, forex traders gain a systematic method for evaluating pullbacks and potential continuation points. When combined with trend analysis, confirmation signals, and disciplined risk management, these levels contribute to a more organized trading approach. Although no technical tool guarantees success, consistent application of Fibonacci principles can enhance clarity and structure within the dynamic environment of the forex market.
This article was last updated on: March 28, 2026