Understanding Technical Analysis
Technical analysis serves as a structured methodology for evaluating financial markets through the examination of historical price data and trading activity. While it is commonly associated with the forex market, it is equally applicable to equities, commodities, indices, and cryptocurrencies. Rather than concentrating primarily on macroeconomic reports, earnings data, or geopolitical developments, technical analysis centers on observable market behavior. It assumes that all known information is already reflected in price and that patterns in price movement tend to repeat over time.
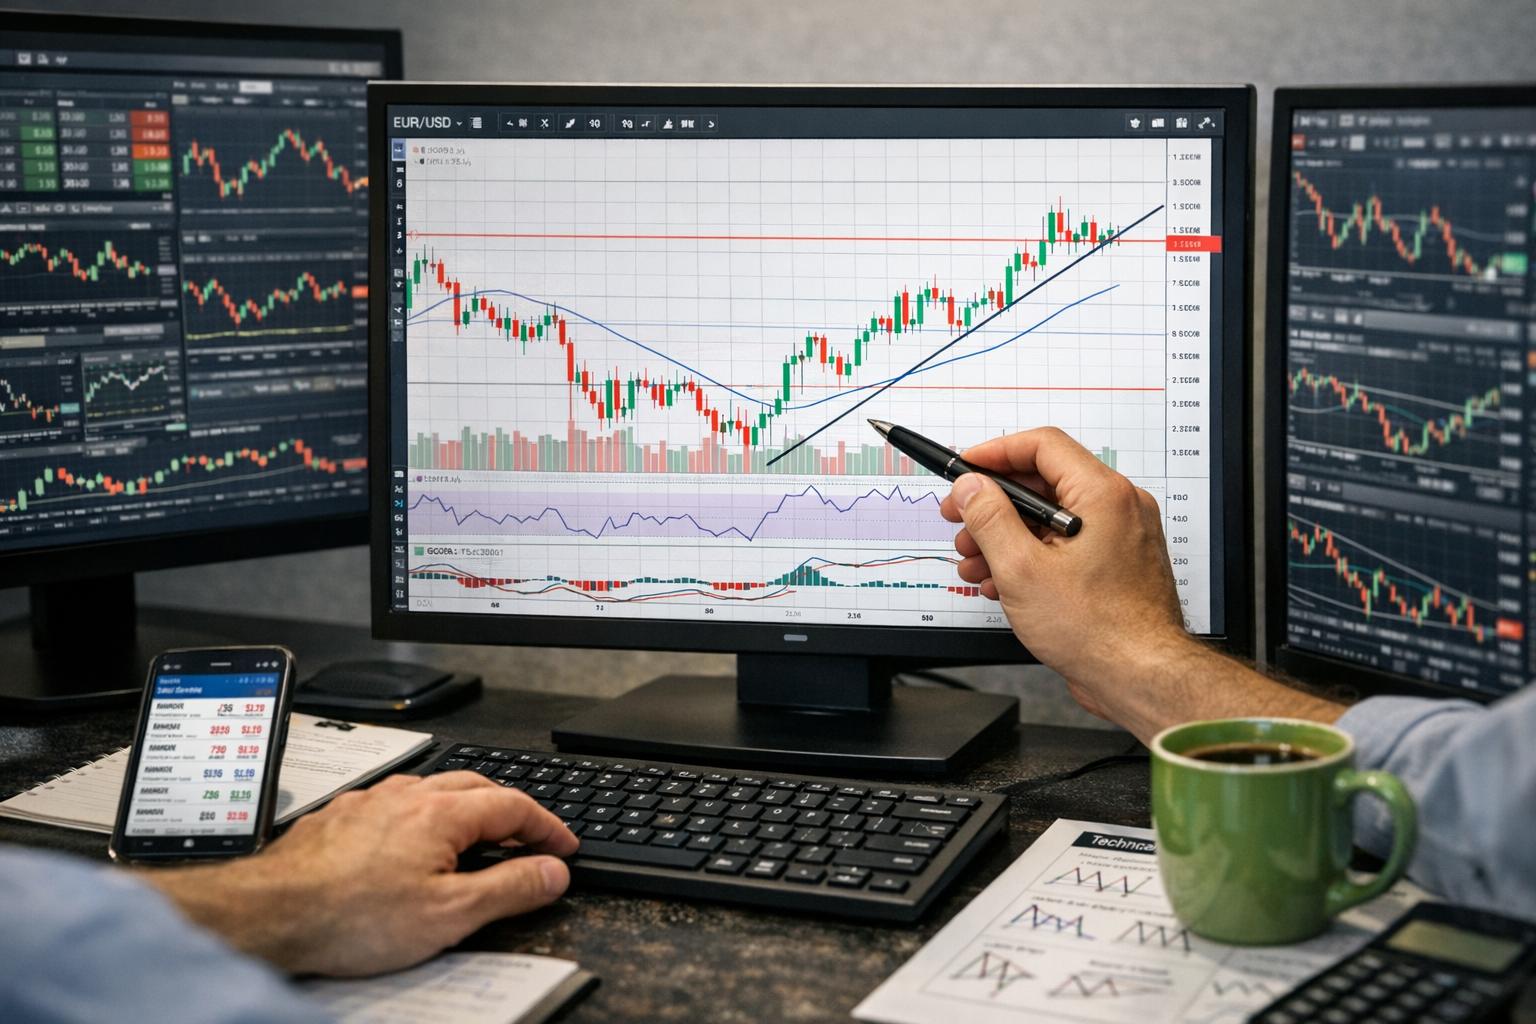
In the forex market, where currencies are traded in pairs and price fluctuations can occur rapidly, technical analysis offers a systematic framework for interpreting market activity. By analyzing charts that display the historical price movement of a currency pair, traders attempt to identify recurring formations, directional biases, areas of supply and demand, and shifts in momentum. These elements help define structured entry and exit points, risk parameters, and trade management decisions.
Technical analysis does not seek to predict the future with certainty. Instead, it evaluates probability. By studying price behavior over time, traders attempt to tilt probabilities in their favor, managing risk while allowing statistical edges to work across a series of trades. This probabilistic nature underscores the importance of discipline, consistency, and structured methodology in applying technical tools effectively.
Core Assumptions of Technical Analysis
Technical analysis rests on several foundational assumptions that shape its application across markets.
The first assumption is that market action discounts everything. This principle suggests that current price reflects all publicly available information, including economic data, political developments, and market sentiment. Even unexpected news is interpreted through price reaction, making price itself the primary focus of analysis.
The second assumption is that prices move in trends. Markets do not typically move randomly; instead, they tend to develop directional biases that persist over measurable periods. Identifying and aligning with these trends forms a central objective of technical evaluation.
The third assumption is that history tends to repeat itself. Market participants often react to similar conditions in comparable ways due to shared behavioral tendencies. As a result, recognizable chart patterns and recurring formations may offer insights into potential future price movement.
Together, these assumptions provide the intellectual framework supporting the tools and techniques used in chart analysis.
Price Charts
Price Charts: At the heart of technical analysis lies the utilization of price charts. These charts are indispensable, offering a vivid illustration of a currency pair’s historical price fluctuations over designated timeframes. Traders commonly engage with different chart types including line charts, bar charts, and candlestick charts. Each chart variety bestows unique visual data concerning price trends and variability, aiding analysts in their pursuit of insightful understanding.
A line chart is the simplest format, typically plotting closing prices over time. It provides a clean representation of general direction but omits detailed intra-period price activity. This simplicity makes it useful for identifying long-term trends without visual clutter.
A bar chart displays four data points for each period: open, high, low, and close. The vertical line represents the range between the high and low, while horizontal marks indicate opening and closing prices. This format conveys more detailed market structure and highlights volatility within each time interval.
Candlestick charts expand upon bar chart information by visually emphasizing the relationship between the opening and closing prices. The body of the candle illustrates the difference between open and close, while wicks (or shadows) show the extremes. Candlestick formations can signal potential reversals, continuation patterns, or indecision in the market. Their visual clarity has made them particularly popular among short-term forex traders.
Timeframes further define chart interpretation. A trader may analyze monthly or weekly charts to determine broader directional bias, then shift to daily, hourly, or minute-based charts to refine trade entries. The ability to interpret price behavior across multiple timeframes is a distinguishing skill within technical analysis.
Trends
Trends: Discernment of trends holds paramount importance in technical analysis. The classification of trends into upward (bullish), downward (bearish), or sideways (ranging) categories establishes a crucial foundation for traders. Recognizing and aligning with the prevailing trend can illuminate the most advantageous direction for executing trades.
An uptrend is characterized by a sequence of higher highs and higher lows. This structure indicates sustained buying pressure over time. In such environments, many traders focus on identifying pullbacks as potential buying opportunities rather than attempting to sell against the dominant direction.
A downtrend displays lower highs and lower lows, reflecting persistent selling pressure. Technical traders often wait for corrective rallies within a downtrend before considering short positions.
A sideways trend, or range-bound market, occurs when price fluctuates between relatively stable support and resistance levels without establishing a clear directional structure. In these conditions, traders may buy near support and sell near resistance, recognizing the absence of sustained momentum.
Trendlines are frequently used to visually define directional movement. By connecting successive lows in an uptrend or successive highs in a downtrend, traders create reference lines that can help anticipate future support or resistance interactions. Breaks of established trendlines may signal potential shifts in market direction.
Support and Resistance Levels
Support and Resistance Levels: These pivotal levels often signal where a price, having reached a particular point, is likely to pause and potentially reverse its course. Support levels mark zones rich in buying interest, effectively counteracting selling pressure. Conversely, resistance levels denote areas where selling power might surpass buying momentum.
Support is typically identified at previous swing lows, psychological price levels, or historically significant consolidation zones. When price revisits these areas, traders observe whether buying activity increases again. A strong defense of support may reinforce its validity.
Resistance is commonly found at prior swing highs or key round numbers. At these levels, prior selling pressure has halted upward movement. Repeated reactions at resistance increase its perceived importance among market participants.
When support or resistance is decisively broken, these levels may reverse roles. Former resistance can become new support, and former support may act as resistance. This dynamic shift illustrates how market memory influences trading behavior.
The reliability of support and resistance often strengthens with repeated testing. However, no level is guaranteed to hold. Traders therefore integrate risk management strategies to account for potential breakouts or false signals.
Technical Indicators
Technical indicators embody mathematical computations predicated on price, volume, or open interest. These instruments are designed to assist in the analysis of market trends. Within this realm, some popular indicators traders frequently adopt include:
Moving Averages: These averages perform a smoothing function on price data, unveiling trends across predetermined periods. Among the variants, simple moving averages (SMA) and exponential moving averages (EMA) are extensively employed for gauging potential market directions.
A simple moving average calculates the arithmetic mean of closing prices over a set number of periods. An exponential moving average assigns greater weight to more recent prices, thereby responding more quickly to current market conditions. Traders often observe crossovers between short-term and long-term averages as possible indications of trend shifts.
Relative Strength Index (RSI): RSI stands as an effective oscillator, designed to measure the velocity and fluctuation of price movements. The index ranges from 0 to 100, offering insights into potential overbought or oversold market conditions. Readings above 70 are frequently interpreted as overbought, while readings below 30 suggest oversold conditions. However, in strong trends, RSI may remain extended for prolonged periods, requiring careful contextual interpretation.
Bollinger Bands: This tool features a middle band, represented by an SMA, flanked by two outer bands indicating volatility. Bollinger Bands assist in identifying price levels that may deviate significantly from equilibrium, highlighting extremely high or low prices. Periods of contraction often precede volatility expansions, while price interaction with outer bands may suggest temporary extremes.
Beyond these widely recognized indicators, traders may utilize tools such as the Moving Average Convergence Divergence (MACD), stochastic oscillators, Fibonacci retracement levels, and the Average True Range (ATR). Each indicator provides a different analytical lens, but no single tool should be relied upon in isolation. Confluence—where multiple factors align—often carries greater analytical weight.
Chart Patterns
Technical analysis also involves the identification of recurring chart patterns that reflect underlying shifts in supply and demand.
Reversal patterns include formations such as head and shoulders, double tops, double bottoms, and triple formations. These patterns may suggest the weakening of an existing trend and potential directional change.
Continuation patterns such as flags, pennants, and triangles indicate temporary consolidation before the prevailing trend resumes. These patterns typically reflect pauses in momentum rather than structural reversals.
While pattern recognition can provide structured trade ideas, confirmation through additional technical tools enhances reliability. Breakout direction, accompanying volume in certain markets, and broader trend context all contribute to pattern evaluation.
Market Structure and Price Action
Many traders emphasize direct price action analysis, focusing on raw candlestick movements without heavy reliance on lagging indicators. This approach interprets rejection wicks, engulfing patterns, inside bars, and consolidation structures to gauge real-time shifts in sentiment.
Market structure—defined by the sequence of highs and lows—offers clarity regarding trend continuity or breakdown. A violation of established structural patterns may signal potential transition phases. This structural perspective encourages traders to analyze how price behaves relative to prior reference points rather than depending exclusively on computed indicators.
Risk Management in Technical Trading
Although technical analysis emphasizes chart interpretation, effective application requires structured risk management. Even high-probability setups can fail. Therefore, defining stop-loss levels, calculating position size, and maintaining favorable risk-to-reward ratios are integral components of the methodology.
Stops are often placed beyond recent swing highs or lows, outside support or resistance zones, or at technical invalidation points. Position sizing ensures that no individual trade significantly impairs overall capital. Many disciplined traders risk only a small percentage of account equity per position, allowing statistical outcomes to unfold over extended sequences.
Consistency in risk application frequently distinguishes sustainable trading performance from inconsistent outcomes.
Implementing Technical Analysis in Forex Day Trading
The seamless integration of technical analysis into forex day trading demands a meticulous blend of discipline and continuous practice. To enhance its efficacy, certain critical steps become apparent:
Choosing the Right Tools: Opting for reliable trading platforms and charting software is foundational, ensuring access to a variety of technical analysis tools and indicators. Selecting tools that harmoniously align with personal trading strategies and preferences is crucial. Execution speed, chart customization, and dependable data feeds are particularly relevant for short-term traders.
Analyzing the Market: Commence by conducting a broad, sweeping analysis of the market to ascertain its positioning within overarching long-term trends. Gradually, narrow the focus to shorter timeframes pertinent to day trading decisions. This multi-timeframe approach ensures that short-term trades align, when possible, with broader structural direction.
Developing a Strategy: Constructing a cohesive, structured trading strategy grounded in technical analysis is essential. Thoroughly define entry and exit points, risk management protocols, and position sizes prior to the execution of trades. Strategies may revolve around breakout trading, pullback entries, range trading, or momentum-based continuation setups.
Continuous Learning and Adaptation: Ongoing learning remains indispensable—staying abreast of market developments while adapting to evolving conditions ensures relevance. Supplementary knowledge concerning macroeconomic factors impacting currency pairs enhances these efforts. Although technical analysis centers on price, awareness of scheduled economic events can prevent unintended exposure to abrupt volatility spikes.
Advantages and Limitations
Technical analysis provides several practical advantages. It offers structured frameworks, visual clarity, and adaptability across timeframes and asset classes. It is particularly suited to short-term trading, where fundamental data may exert slower influence than immediate price behavior.
However, limitations exist. Indicators often lag because they are derived from historical data. False breakouts can occur, especially in low-liquidity conditions. Overuse of multiple indicators may result in conflicting signals and analytical complexity.
Recognizing these limitations encourages balanced application. Technical tools function most effectively when integrated within disciplined risk parameters and consistent strategy execution.
Conclusion
The incorporation of technical analysis into forex day trading provides traders with a structured framework to navigate the intricacies of the currency market. With a firm grasp and application of essential elements—such as price charts, trending patterns, support and resistance levels, and critical technical indicators—traders fortify their decision-making processes. Through disciplined implementation, structured risk management, and ongoing refinement of analytical skills, technical analysis evolves into a practical component within a trader’s broader methodology. While no approach guarantees outcomes, a well-developed technical framework offers measurable structure for interpreting price behavior and managing uncertainty in dynamic financial markets.
This article was last updated on: March 28, 2026